Contents
- What inspired the Economic Value Atlas?
- Bringing economic values to regional planning: The stakeholder table
- Grounding economic conditions in place: The Market Scan
- Translating values into data: Constructing the Economic Value Atlas
- The Economic Value Atlas in action
- What’s next
Metropolitan areas need a new approach to regional economic development and infrastructure investment. Competition to attract the most productive industries and workers, rising price tags on large and small infrastructure projects, an emerging focus on inclusive economic outcomes, and demand for more livable and resilient neighborhoods all place significant pressures on regional leaders to deliver an advanced, competitive economy that works for all people. That means old policy playbooks that overly focus on business recruitment and congestion mitigation will no longer suffice.
Instead, metropolitan governments and their civic partners need a suite of land use and infrastructure policies and practices that work in service of broader economic objectives.
Over the past 18 months, the Brookings Institution’s Metropolitan Policy Program worked alongside Metro—Portland, Oregon’s metropolitan planning organization—to begin addressing this need. The result of that effort is the Economic Value Atlas, or EVA. The objective of the Economic Value Atlas is to better align economic development, regional planning, and infrastructure investment in support of regional economic goals.
The EVA offers a suite of tools and processes to bring this multidisciplinary approach to reality. Through the guise of a new mapping application, the EVA compels metropolitan stakeholders to sit around a common table, develop shared values, dissect where regional economic outcomes fall short, and then actively consider policy reforms to address those shortcomings head-on. The EVA also demonstrates a platform that does not shy away from complexity, giving stakeholders a single place to consider trade, innovation, skills development, and quality placemaking.
This research brief outlines the steps taken in metropolitan Portland to build an EVA, which can serve as a model for other metropolitan areas across the country looking to bring more economic-driven thinking to their regional planning and investment policies and practices. The brief also includes extensive references to the beta EVA application, which is accessible at Metro’s website.
What inspired the Economic Value Atlas?
The EVA is a natural response to a growing realization among economic development, urban planning, and transportation professionals that their respective disciplines need greater alignment. This was certainly the case in metropolitan Portland, Ore.-Wash.
With a regional light rail system, extensive bicycle infrastructure, and a closely-managed urban growth boundary, Portland had a track record of successfully building great places. The economy was also on a hot streak through the first two decades of the 21st century: tradable industries were growing, average wages were rising, in-migration was happening. But amid all this success, not all outcomes reflected the region’s shared values: congestion and driving rates remained high; housing prices were rising faster than median wages; entrepreneurship rates fell below regional targets; and not all neighborhoods offered physical quality and economic accessibility. Officials recognized that failing to address these more troubling outcomes could limit Portland’s long-run growth.
In response, Metro sought a new approach that would bring economic development thinking into their operational DNA, while also forging stronger relationships with economic development organizations to improve their understanding of how regional planning and infrastructure investment works. At the center of that approach, the EVA would act like a Rosetta Stone, providing a toolset that connects often-disconnected professional disciplines and promotes consensus around future urban planning and infrastructure investment.
The economic and governance challenges metro Portland faces are no different than peer regions.
All across the country, metropolitan planning organizations (MPOs) and Councils of Government (COGs) are responsible for coordinating land use and infrastructure planning decisions at a regional scale. However, the political and bureaucratic processes that govern their land use and transportation decisions do not require consideration of wider goals of economic growth and opportunity. As a result, MPOs and COGs have lacked the tools and insights to invest in ways that will undergird economic growth.
At the same time, economic development practitioners across the country have begun to recognize the need to evolve in the face of a changing economic climate. Macroeconomic trends such as automation, declining entrepreneurship, and decreased business relocations are forcing a re-think of strategies focused primarily on outside business recruitment, large firm support, and lobbying for large infrastructure projects. An emerging field of inclusive economic development presents a new model to set regional priorities.
The EVA is a replicable tool to bring these disciplines closer together. Whether in metropolitan Portland or somewhere else, the EVA can help MPO and COG leaders partner with regional peers to develop shared economic intelligence—including how the built environment currently supports or restricts the drivers of economic growth—and then use that intelligence to inform future planning and investment decisions.
Bringing economic values to regional planning: The stakeholder table
It’s easy to operate in silos. Urban planners and transportation engineers are trained to deliver solutions using their own individual expertise, whether they are measuring traffic or designing sidewalks. The same applies to economic development officials, who often specialize in business attraction and retention. It takes intentional efforts to unite these related, but separate disciplines.
Metro recognized the need for a common table where a diverse set of stakeholders could sit together to discuss Portland’s economic and physical future. Brookings regularly uses such tables as part of our local engagement work—whether the topic is exports, foreign direct investment, or inclusive economic development—and one of the key features is a lead convener. Serving in that capacity, Metro gathered members that reflected a mix of public, private, and civic interests: workforce and community development, regional business groups, municipal agencies, port authorities, statewide economic development, university research groups, and Metro’s peer across the Columbia River, Southwest Washington Regional Transportation Council.
The stakeholders’ initial responsibility was to help Metro develop a set of shared economic values. Metro used the Greater Portland 2020 framework co-developed by Greater Portland Inc.—a public-private partnership that engages in regional economic development—and regional partners as the starting point for those conversations. Metro and the stakeholders eventually agreed on a set of 12 values that capture desired outcomes across businesses (e.g., “Support entrepreneurs and startups that advance innovation), people (e.g., “Grow and improve access to businesses with middle wage job opportunities and high opportunity occupations”), and places (e.g., “Stabilize communities and enhance local real estate markets”).

Once the group agreed on economic values, it morphed into an advisory board for ongoing EVA activities. A technical-focused subgroup emerged to discuss economic findings and debate analytical measures. Metro continued to regularly convene the entire stakeholder group to serve as a sounding board for tool development and local use cases. These regular meetings also created a new forum to stay current on local economic dynamics. The table’s permanence ensured Metro built strong, long-term relationships in the greater Portland community.
Grounding economic conditions in place: The Market Scan
To better understand performance against shared economic values, Metro recognized the need for a common set of economic facts. That would require a clear set of benchmarks to judge where the region’s economy stood today and what pressing challenges may lie ahead. Metro staff and stakeholders also expressed interest in external and internal context for those benchmarks: how did Portland compare to peer metro areas and how did Portland’s neighborhoods compare to metropolitan averages? Finally, even in a region that conducts significant local research, it was still important to have a singular document that reported facts across both the economic, planning, and transportation disciplines.
Brookings staff developed a “Market Scan” to tackle these questions; the report’s executive summary and full text can be found on a tandem web page. Overall, the results confirmed Portland was home to a surging advanced economy that was not always delivering shared prosperity. By comparing specific local conditions to metropolitan averages—including poverty levels, transportation access to jobs, and housing affordability—the results also confirmed how unequal these trends were across neighborhoods. For example, maps showed how housing construction permits tended to concentrate outside neighborhoods with higher poverty rates. The Market Scan also marked the first time many stakeholders saw certain economic data married to geographic visualizations, including the location of target industries clusters (see below).

Critically, the Market Scan showed how economic analysis, built environment data, and accessible mapping could enhance regional collaboration. Across multiple presentations at Metro’s offices and in front of business and local government leaders, the Market Scan’s results inspired thoughtful conversations about the kind of outcomes the next round of land use plans and infrastructure investment should aim to address. The Market Scan was a proof-of-concept for what the EVA could eventually deliver.
Translating values into data: Constructing the Economic Value Atlas
With shared economic values determined and the Market Scan receiving positive feedback, Metro and Brookings began designing the EVA. This would require an entirely new back- and front-end system: new datasets, new measurement schemes, new stakeholder interviews, and a new user-facing application to capture it all. The objective was to design an application that would help the EVA’s primary users—practitioners within economic development organizations, nonprofit organizations, and local governments—better understand connections between the region’s economy and place-based conditions.
Building the EVA started with major data and usability concerns. The measurement system needed to account for differences in geographic fidelity; many of the most important regional economic measures—including entrepreneurism, industrial output, and commuting choices—are either not available at a neighborhood level or of poor quality. The data selections would need to be manageable for the user; dumping too many measures into the EVA could overwhelm people and discourage use. Finally, the EVA needed to be flexible and customizable; the data fields should stay constant over time while allowing Metro to update shared economic values and the underlying data.
Brookings worked with Metro to design a toolset that would respond to these technical concerns while not losing sight of the EVA’s core objective: to better align economic development, regional planning, and infrastructure investment. Two memoranda—one related to performance measures and another related to use cases—detail the majority of the recommendations from Brookings. The eventual EVA design reflects four distinct choices:
1. The EVA uses a series of indicators to convert shared economic values into specific performance measures. Brookings and Metro realized each of the region’s 12 shared values mapped directly to more universal economic development or placemaking principles, such as promoting industrial innovation or more affordable cost of living. Brookings distilled those principles into a set of more common indicators, which then made it easier to select specific performance measures related to each indicator.
 *NOTE: These are the original Brookings recommendations, not what Metro now uses in the EVA
2. The EVA uses three tiers to organize data: Metropolitan Measures, Community Measures, and Overlay Data. Since not all data is available at sub-county geographies, the EVA does not try to force regional measurement to perfectly match sub-county measurement. In addition, since stakeholders wanted to map even more data than the EVA could reasonably measure, the Overlay tier serves as a “spillover” category to map supplemental data.
3. The EVA uses census geographic definitions and publicly available data to ease toolset management. Census tracts serve as the neighborhood proxy, giving the EVA the widest possible range of sub-county data fields to include. Just as importantly, using standard census geography—from tracts to counties—facilitates long-run data updates. The current EVA also uses only publicly available data, including Metro’s enormous internal database that tracks many built environment conditions.
4. The EVA uses standard scores to enable real-time, multivariate indexing of all Community Measures. Converting all neighborhood datasets into standard scores means every measure sits on a 0 to 10 scale—no matter the data range, no matter the format. This allows EVA users to quickly make maps and new data outputs based on “stacks” of different measures, enabling an effectively limitless amount of performance measure combinations. Critically, standard scores also tend to highlight outliers, which is an effective way for EVA users to find cold- or hotspots on the map.
Metro’s internal software developers built a beta version of the tool while Brookings and Metro staff built the database. The user interface allows rapid-fire mapping updates, enabling users to click ‘on’ and ‘off’ measures to their liking. Charts and data are also immediately available to benchmark any tract against metropolitan averages. Importantly, Metro’s coders designed the user interface so other metropolitan areas could modify the template for local tastes.
Taken together, the EVA’s data structure and application allow Metro and other stakeholders to easily assess regional and neighborhood economic performance across a slew of different measures. The result is a productivity boost to anyone who wants to understand how metropolitan Portland’s economy and transportation systems perform—reducing the time it takes to map and chart data from hours to seconds—and freeing up time to analyze the results.
The Economic Value Atlas in action
The EVA application demonstrates the power of this performance measurement system. The EVA is flexible enough to begin addressing some of the most pressing spatial challenges facing the metro area. Here are some examples of the valuable insights users can derive from the system.
How can e-commerce site selections benefit both the companies and their workforce?
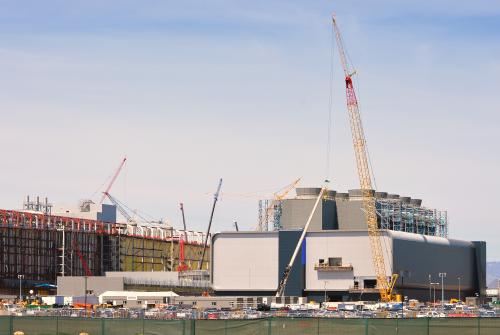
E-commerce’s rapid growth affects more than just how consumers get their goods. E-commerce companies have a different set of real estate demands than their brick-and-mortar peers, especially around large and small warehouses. How that site selection process goes not only will impact local freight patterns—warehouse locations also impact how easily workers can get to these growing job centers. Take for example Minneapolis, Minn., where Amazon located a large warehouse in suburban Shakopee. The facility was freight-efficient but too far away from its target workforce, causing immediate commuting challenges and requiring tailored transit service around the warehouse’s shift hours.
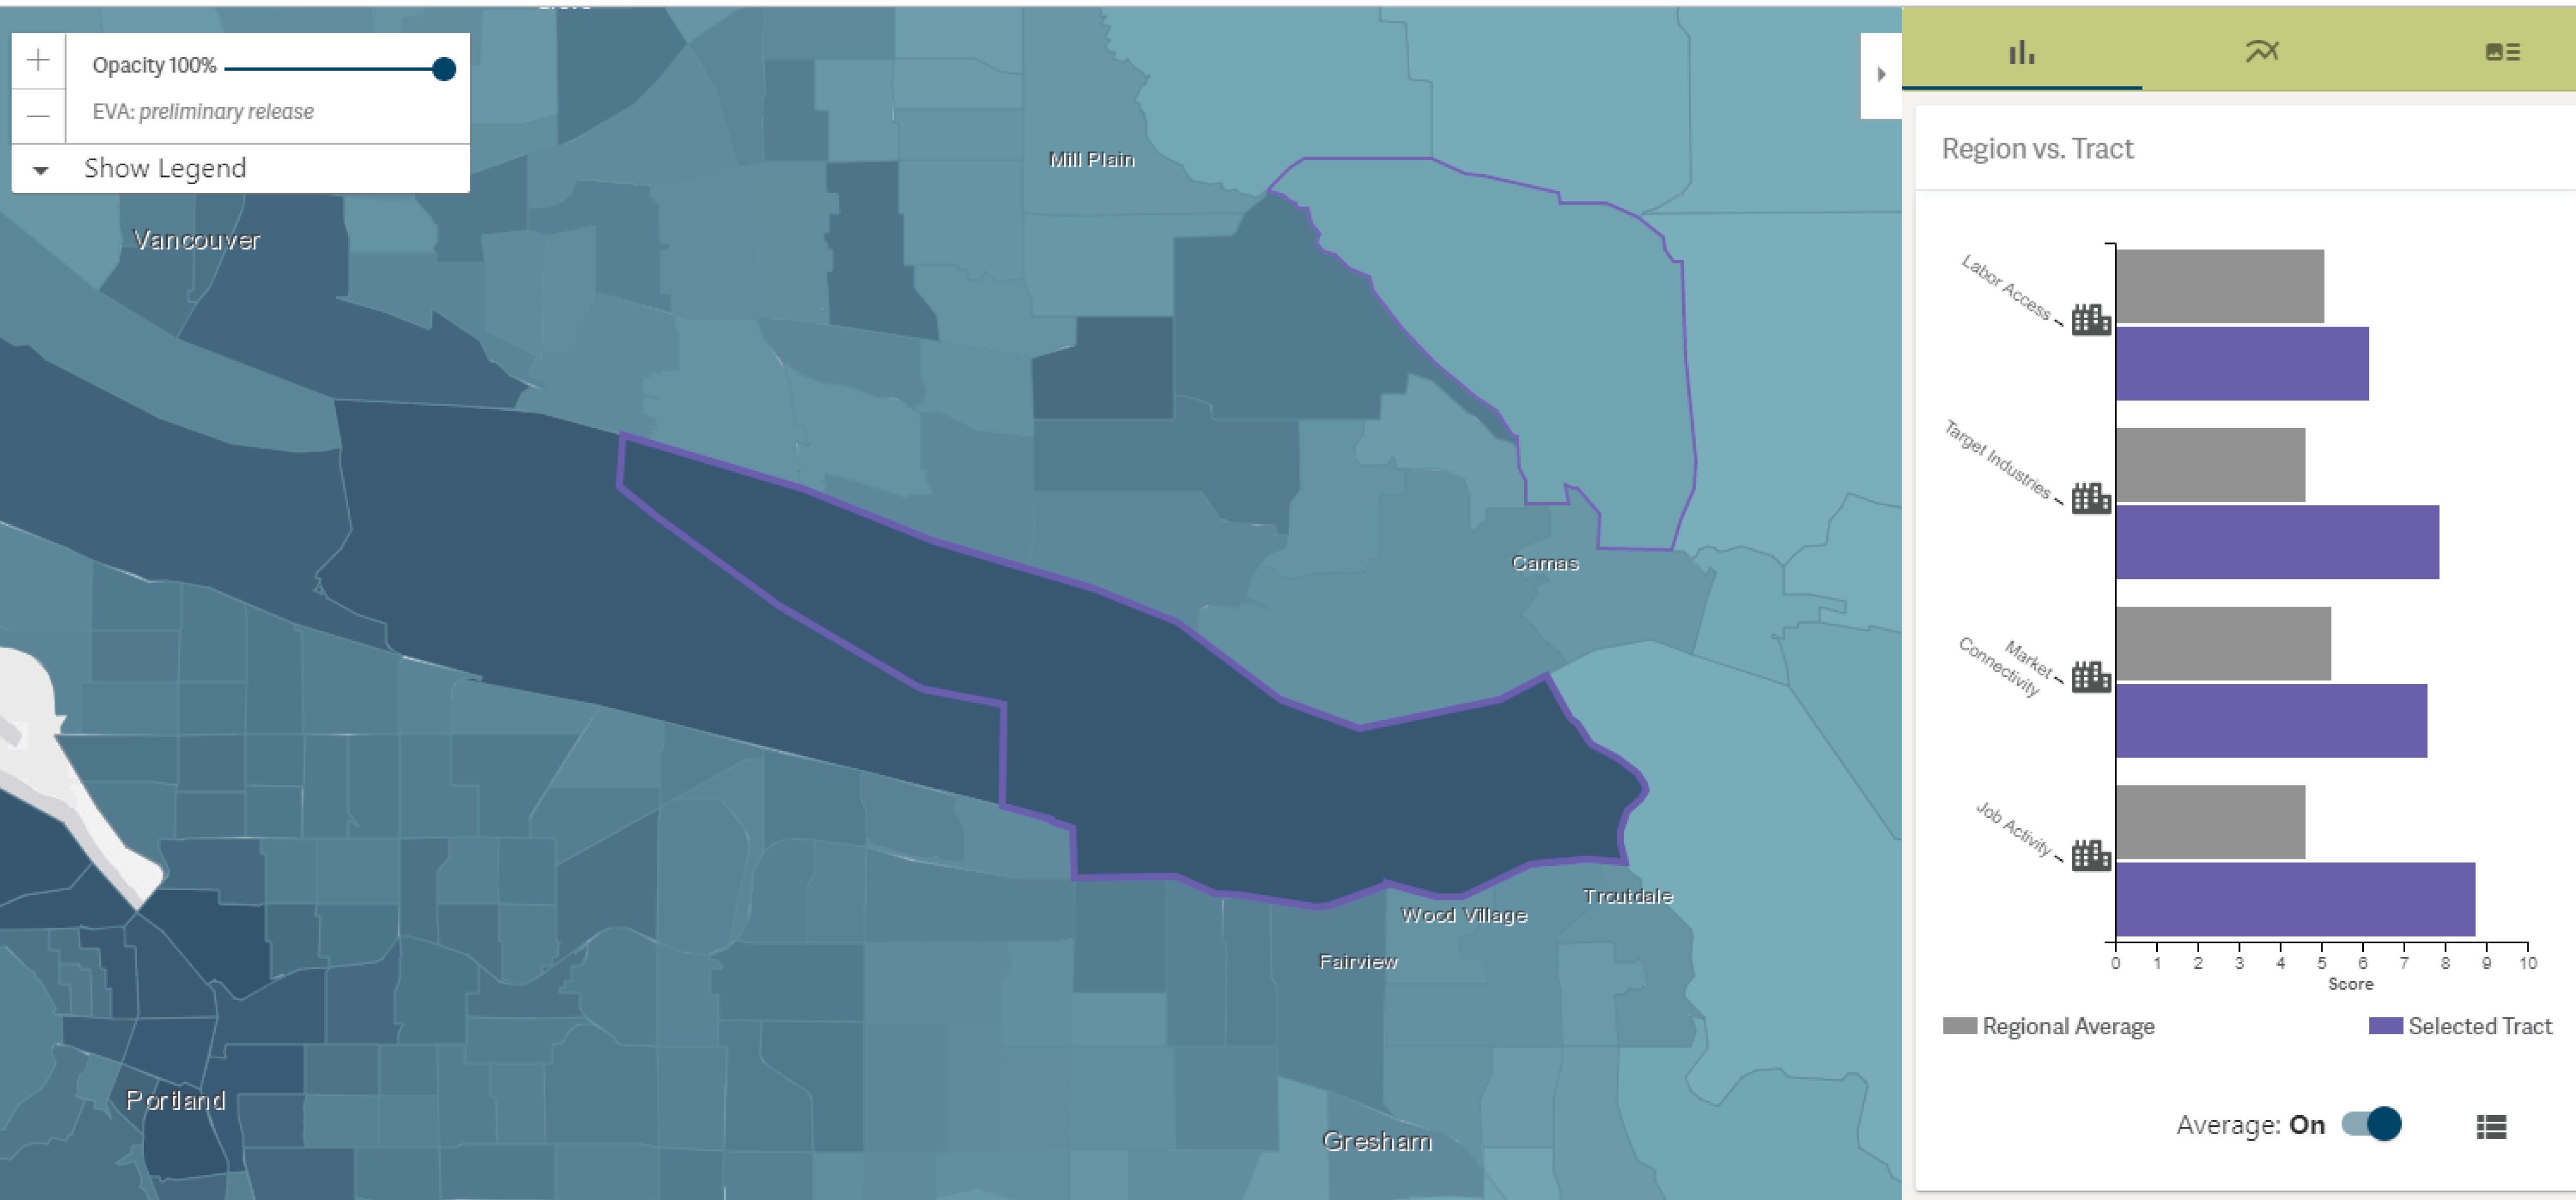
The EVA includes three performance measures that could allow Portland to sidestep some of the challenges metropolitan Minneapolis faced. A “market connectivity” measure shows how quickly trucks can bring goods from outside the metro area to each tract. The EVA also includes a “labor access” measure to show how well workers—in this case entry-level—could reach employers in each tract. Finally, a measure of industrial/commercial acres of buildable land indicates where space is available for large warehouses. Stacking these three measures reveals hotspots where freight and labor access are high, and strong development potential exists. In Portland’s case, Amazon ended up building a large warehouse exactly where the EVA suggested they should: a logistics- and land-rich neighborhood with easy access for entry-level workers (see the purple selection). These kinds of findings can help both economic development officials—who help local and outside companies with site selection—and their peers in real estate development and public land use planning to prioritize specific land development.
What neighborhoods are experiencing gentrification and where could it happen next?
Gentrification is a pressing issue for metropolitan Portland, especially in the central city. Neighborhoods that offer affordable housing and easy access to high-frequency regional transit are seeing surges in real estate demand, leading to higher prices and demographic change among local residents. With so many metropolitan Portland organizations prioritizing “affordability and diversity” within their definitions of quality places, it’s important to have a tool that better indicates where gentrification is already happening and to get a better sense of where it may happen next.
The EVA includes a series of measures that, when combined, can highlight neighborhood-level gentrification. The below map stacks five variables to show where rental housing affordability, housing construction, walkability, median income growth, and the non-white population are high. The darkest tracts are diverse, livable places that—due to upgraded housing stock and rising incomes—could soon price certain groups out. The selected tract (in purple) is north of two tracts already gentrifying, but where housing construction is low. Could this be the next neighborhood to undergo rapid change, and how could housing affordability policies ensure this neighborhood retains an inclusive character?
How could future transportation and workforce development investments address those most in need?
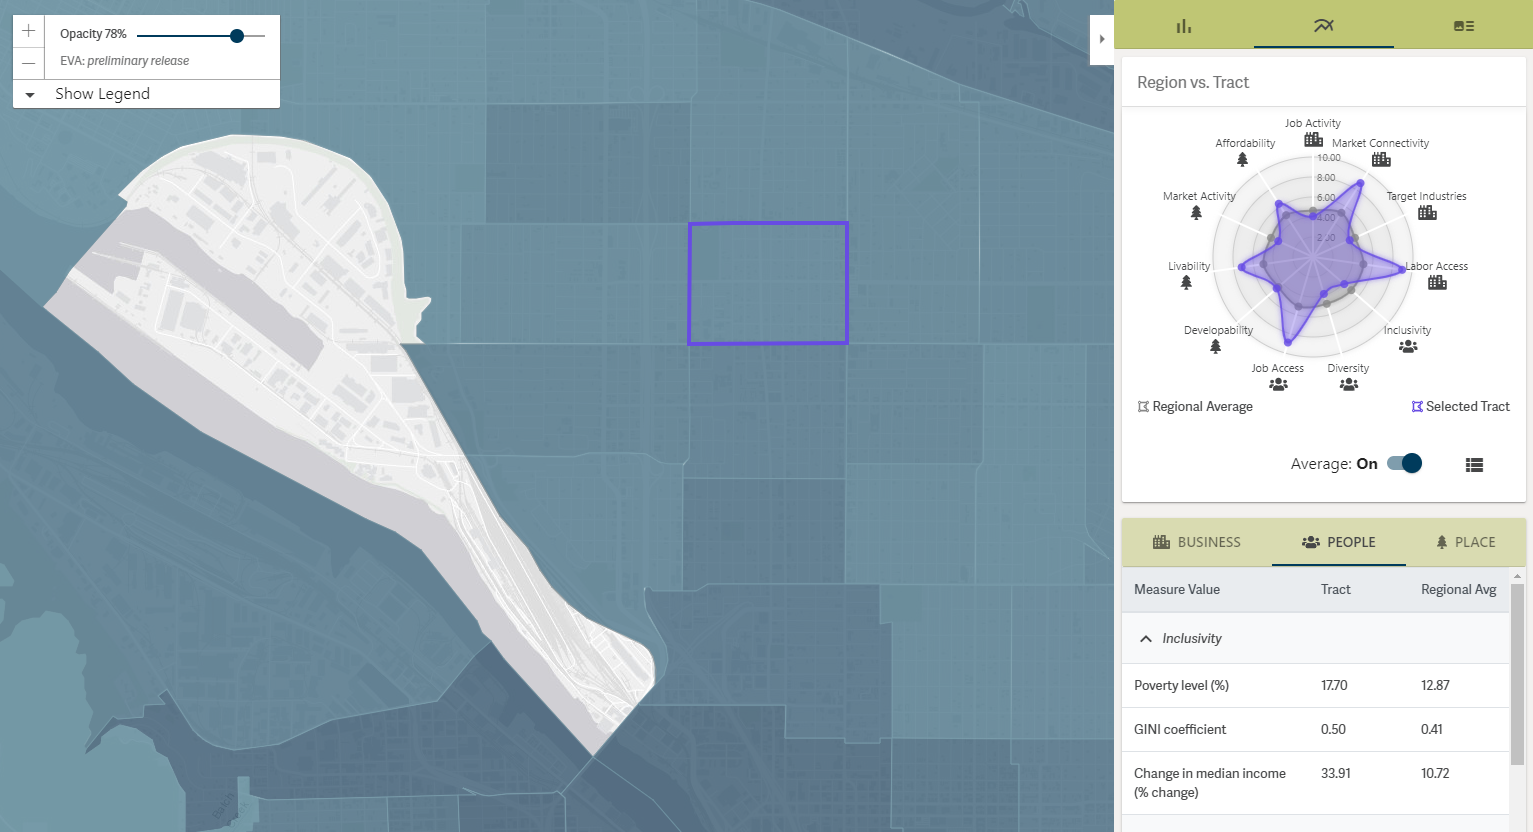
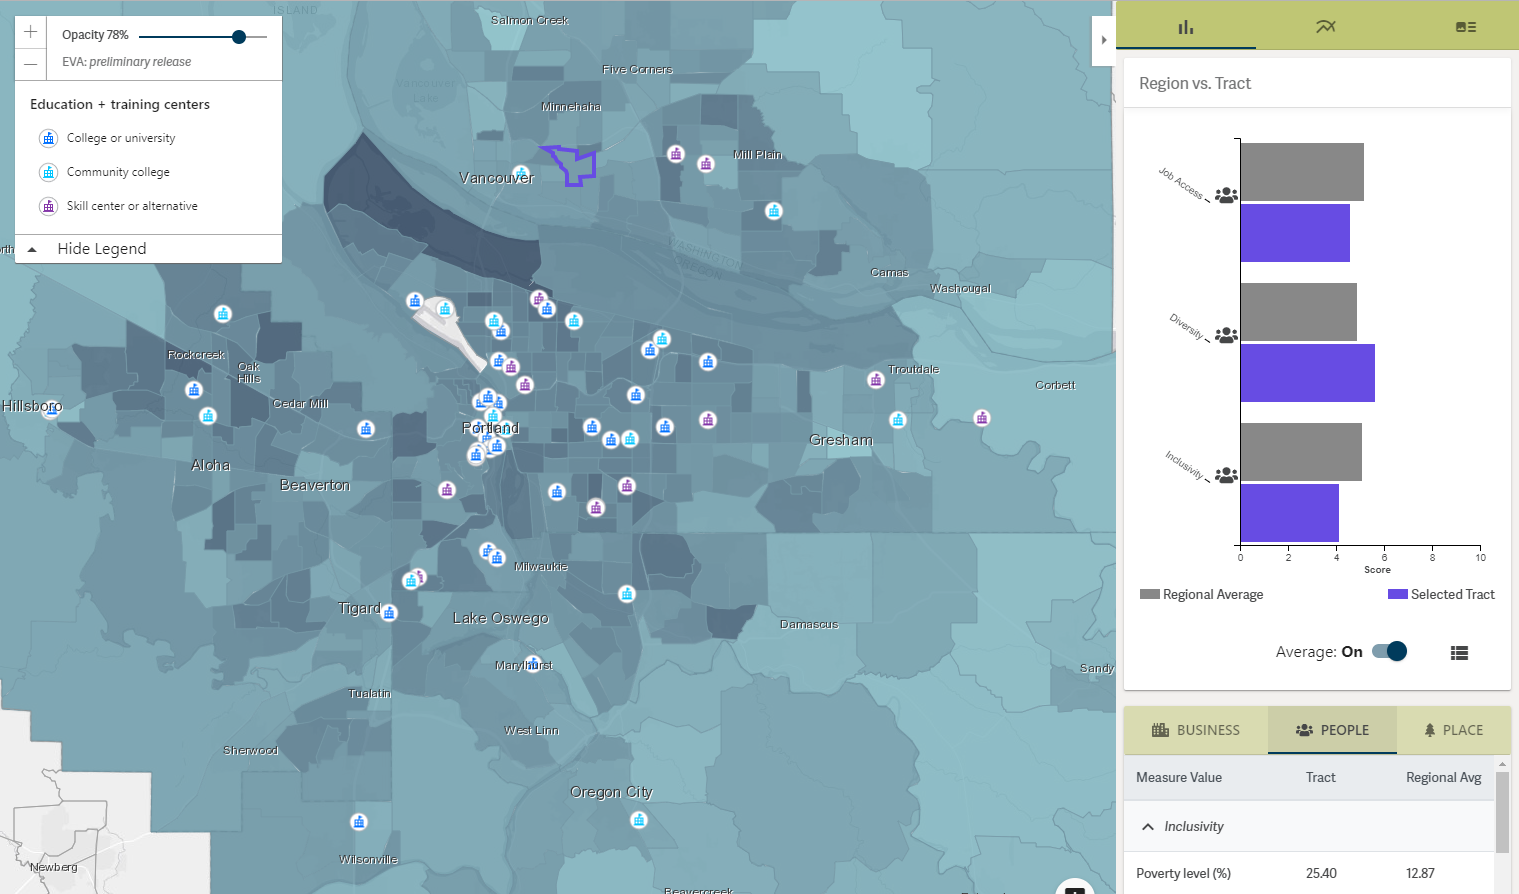
Stakeholders in metropolitan Portland want to ensure that residents of all incomes can physically reach employment and professional training opportunities. This concept of accessibility is especially important as poverty continues to suburbanize, since physical access to these critical destinations can be challenging for low-income households who do not own a vehicle. Discovering how well transportation networks align with the locations of jobs and training opportunities is an important tool for land use and transportation planners to directly address economic inequality.
The lighter areas on the next map show neighborhoods where poverty rates are high, walkability is low, and access to jobs via transit is also low. While central Portland looks impressive and the jobs-rich corridor to Hillsboro, Ore. also shows average results, low-performing neighborhoods dot the eastern and northern edges of the metropolitan area. Neighborhoods like the one selected in Vancouver, Wash. have high poverty rates and struggle to connect people without cars to opportunity. This map also shows how overlaying the data works, by visualizing advanced educational institutions and training centers. For many transit-poor, low-income tracts, training centers may not be close by either.
What’s next
The Portland EVA is still under construction. Metro’s developer team will continue to add features, including a Metropolitan Measures module to allow users to jump from regional performance to tract-level mapping of the same indicators. Metro staff also continue to run EVA demonstrations across the region for local governments, business groups, and nonprofit organizations, to raise community awareness and encourage regional collaboration.
Metro has also begun integrating the EVA within its own formal policy frameworks. An implementation memo prepared by Brookings offers one roadmap, but it will be up to Metro staff to determine their highest priorities. Generally, updated policies and practices fall into two buckets.
The first reflects more immediate implementation opportunities. For example, the EVA can serve as a common platform to compare capital projects competing for limited funds. Metro’s Regional Flexible Funds Allocation (RFFA) and Metropolitan Transportation Improvement Program (MTIP) could both develop a pilot application template to use the EVA to inform project selections. The EVA can also help communicate Metro’s regional priorities. With the passage of Portland’s landmark regional housing bond in 2018, Metro—as the lead administrator of that program—has an opportunity to use the EVA to explain why certain neighborhoods are targeted for housing investment.
The second implementation bucket reflects longer-term reforms that will take more extensive preparation. This could include amendments to the Regional Transportation Plan (RTP), a long-range planning process conducted every five years by every MPO across the country. Multiple components of the RTP—including its economic-driven objectives to project evaluations—could include EVA-powered components. Similarly, as Metro considers updates to its overall 2040 growth strategy, the EVA can help set priorities for multidecade development. Finally, stakeholders across Portland also asked for a new method to evaluate how past investments—like the MAX light rail and zoning reforms—led to economic change within neighborhoods. With slight tweaks to the EVA’s data inputs, it could help deliver such insights.
Of course, Metro isn’t the only government agency or organization that can formally apply the EVA within its operational frameworks.
The Port of Portland intends to use the EVA to consider reforms to how the agency approaches industrial real estate development. As one of the largest industrial landholders in the region and with an active approach to acquisition, the Port must consider how industrial real estate demand has shifted away from large lots toward smaller ones. The Columbia River Economic Development Council, a public-private partnership working to advance the economic vitality in Clark County, Wash., plans to use the EVA to determine how well each neighborhood connects to freight facilities and their local workforce.
Nor is Portland the only region where the EVA can make a difference.
Every metropolitan area could use the EVA approach to rethink how to build regional consensus around shared values, analyze economic performance through a land use and infrastructure context, and design policy reforms that account for EVA-driven findings. And as more metro areas test the EVA approach, their results will help tailored EVA application designs and implementable reforms scale to even more places. The EVA has a genuine chance to usher in a new approach to regional planning and investment.
Related Content


Authors