This week I wanted to challenge myself to learn how to use Plotly, as those always look so nice. The other thing I wanted was to clear up some questions I had with WMTA’s budget numbers. They do a very nice job telling a visual story, but I was a little flummoxed by the absence of a full revenue chart. I also wanted to learn more about ImageMagick colors, so there’s that, too.
It’s very difficult to compare transit agency budgets; not all use zero-based budgeting and they are quite different in terms of their scope and service spans. NY Metro is so much bigger than everybody else; very few agencies cross state and county lines. But I picked five relatively large, inter-jurisdictional direct service providers. These data are all from the NTD.
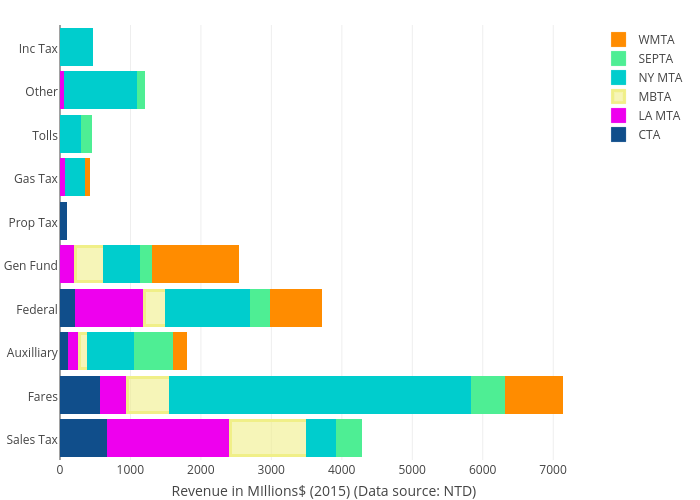
This first chart is a bit weird, but stick with me. I wanted to see who was getting what from where, and how much. I was rather interested in looking at the raw budget numbers by revenue category as whole. I do like it, as it helps us see how important in the big transit picture each type of funding source is. We do tend to point out that fares do not cover costs, and yet this shows that fares are important, overall. They may be much less important in Los Angeles than sales taxes, but in other systems, fares are important. We can also see who is getting what from the Feds, at least this year, 2015.
This next one gets us to the proportions that I suspect most people care about, and the scratchy, uncomfortable feeling I have with the dependence that so many of our big transit agencies have on sales taxes. I get into a lot of trouble saying that I don’t love our transit sales tax measures. I get why LA people support them, but it’s hard for me to tolerate the whinging about small ridership gains when we don’t act more aggressively with gasoline taxes and tolls. There is really no reason why we shouldn’t be doing both tolls and a local option gasoline tax instead of sales tax after sales tax, other than the political difficulties of expecting drivers in LA to pay. If we can’t raise the costs of driving relative to taking transit, I think we are going to be frustrated by underperforming investments for a very long time.
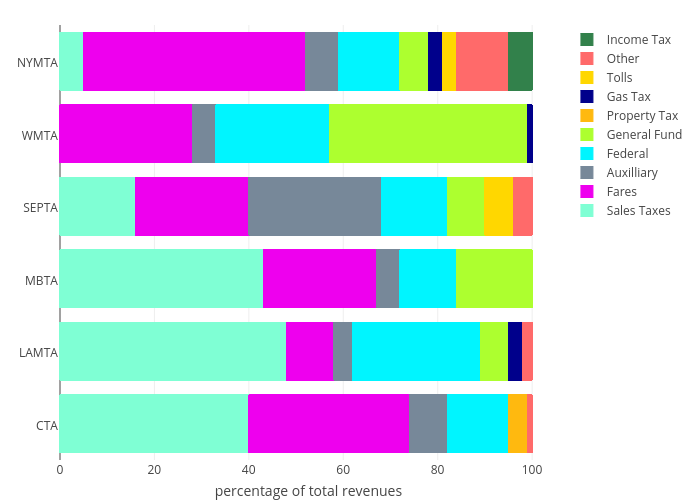
And sales tax revenue is hella volatile and follows the business cycle, so that agencies relying on them for half their budget on sales taxes, like the LA Metro, get to have the floor fall out from under them every time there is a recession.
These are both public and in Plotly, so you can diddle with them, too. For those interested, these data went from Excel to R to Plotly with direct stream through R to the Plotly API.
Neither chart shows up.
I agree, a local gas tax is a much better place to look for revenue than a general sales tax, but the tax will end up being quite large to raise the same amount of funding.
Tolls would be great to manage road demand even if the funding went to planting trees in the desert. I am not sure what kind of revenue could be generated off turning LA’s freeways into tollways.
I think it is striking how little LA gets from fare revenue. LA Metro has higher ridership than WMATA, MBTA and SEPTA(considerably); it is a little below CTA. Yet the fare revenue is much lower, about half on average.
Is this more a reflection of the amount of service LA provides by bus, which are more expensive per rider or is it to do with LA having such low fares?
Well at least this year the California legislature broke the barrier of increasing the gas tax, though it could certainly be more. In the Bay Area, the Metropolitan Transportation Commission has had the legal authority to place a regional gas tax measure on the ballot. But MTC has not wanted to do that, arguing that the measure would lose.
A post responding to the widely held belief that toll lanes are “Lexus lanes” and regressive would be interesting.
Lisa,
Very informative, thank you!
Blair
Sent from my iPhone
>