
Pedestrians in Traffic Environments: Ultrafine Particle Respiratory Doses

 ,
,
Abstract
:1. Introduction
2. Experiments
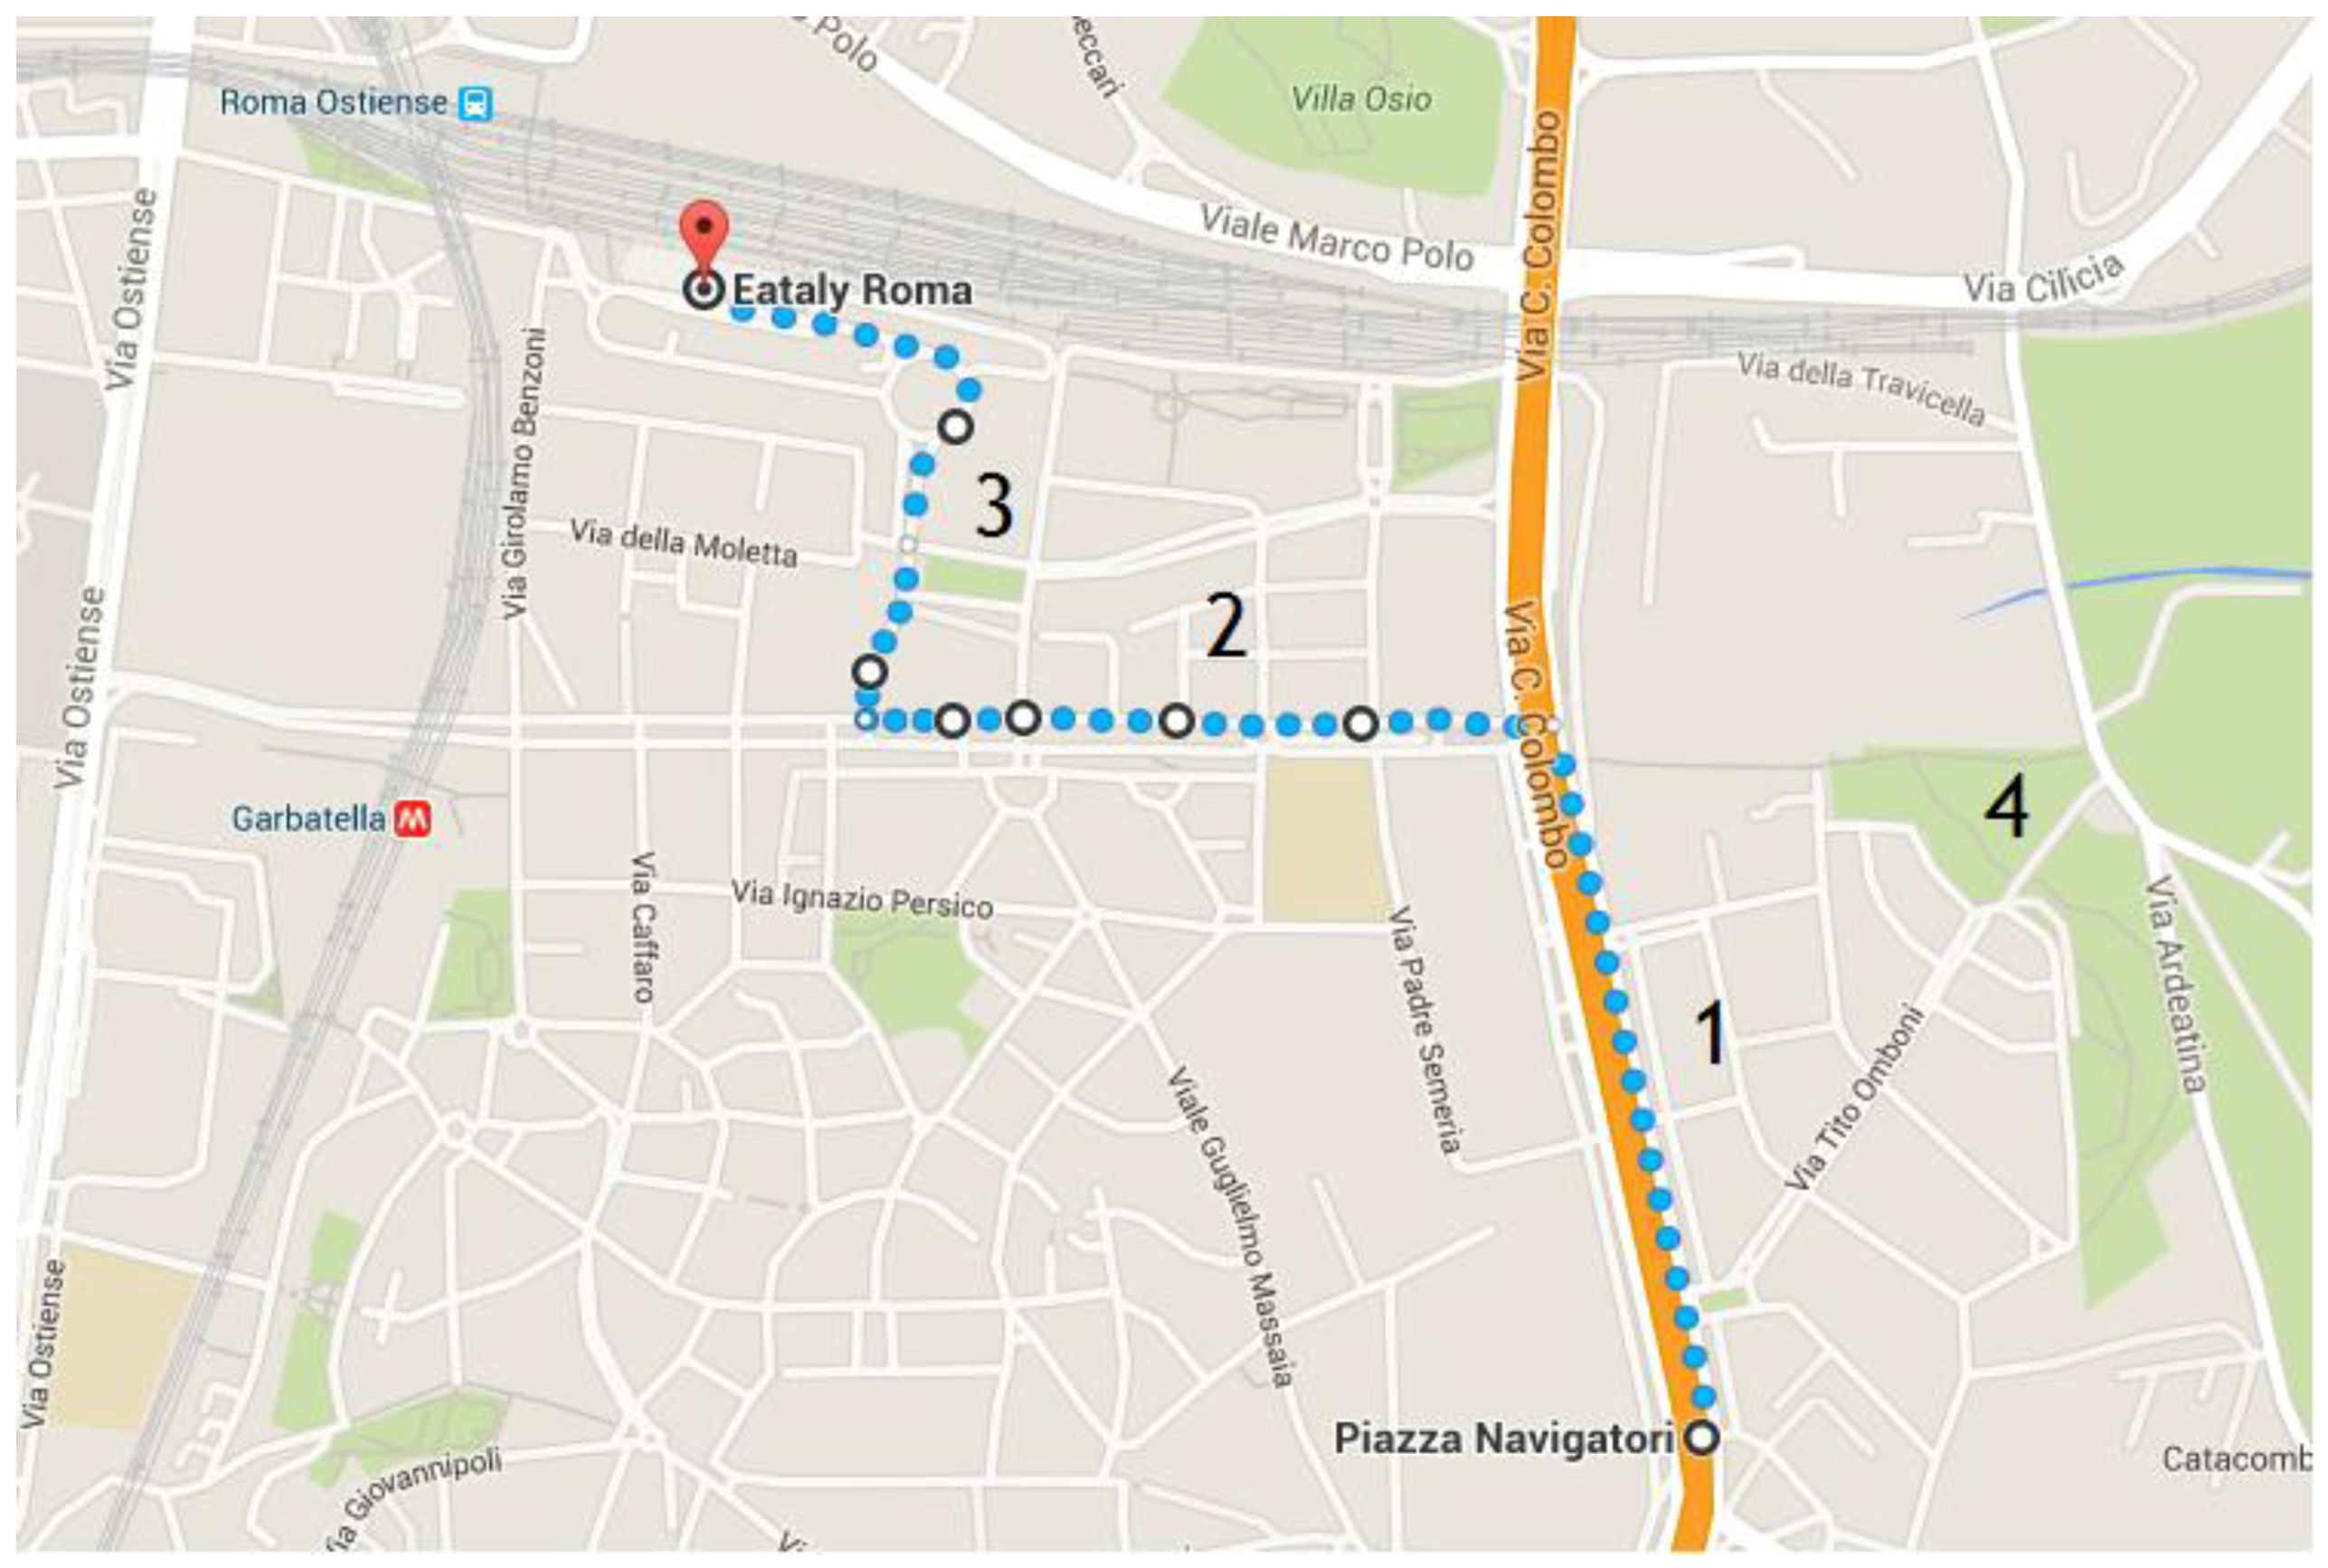
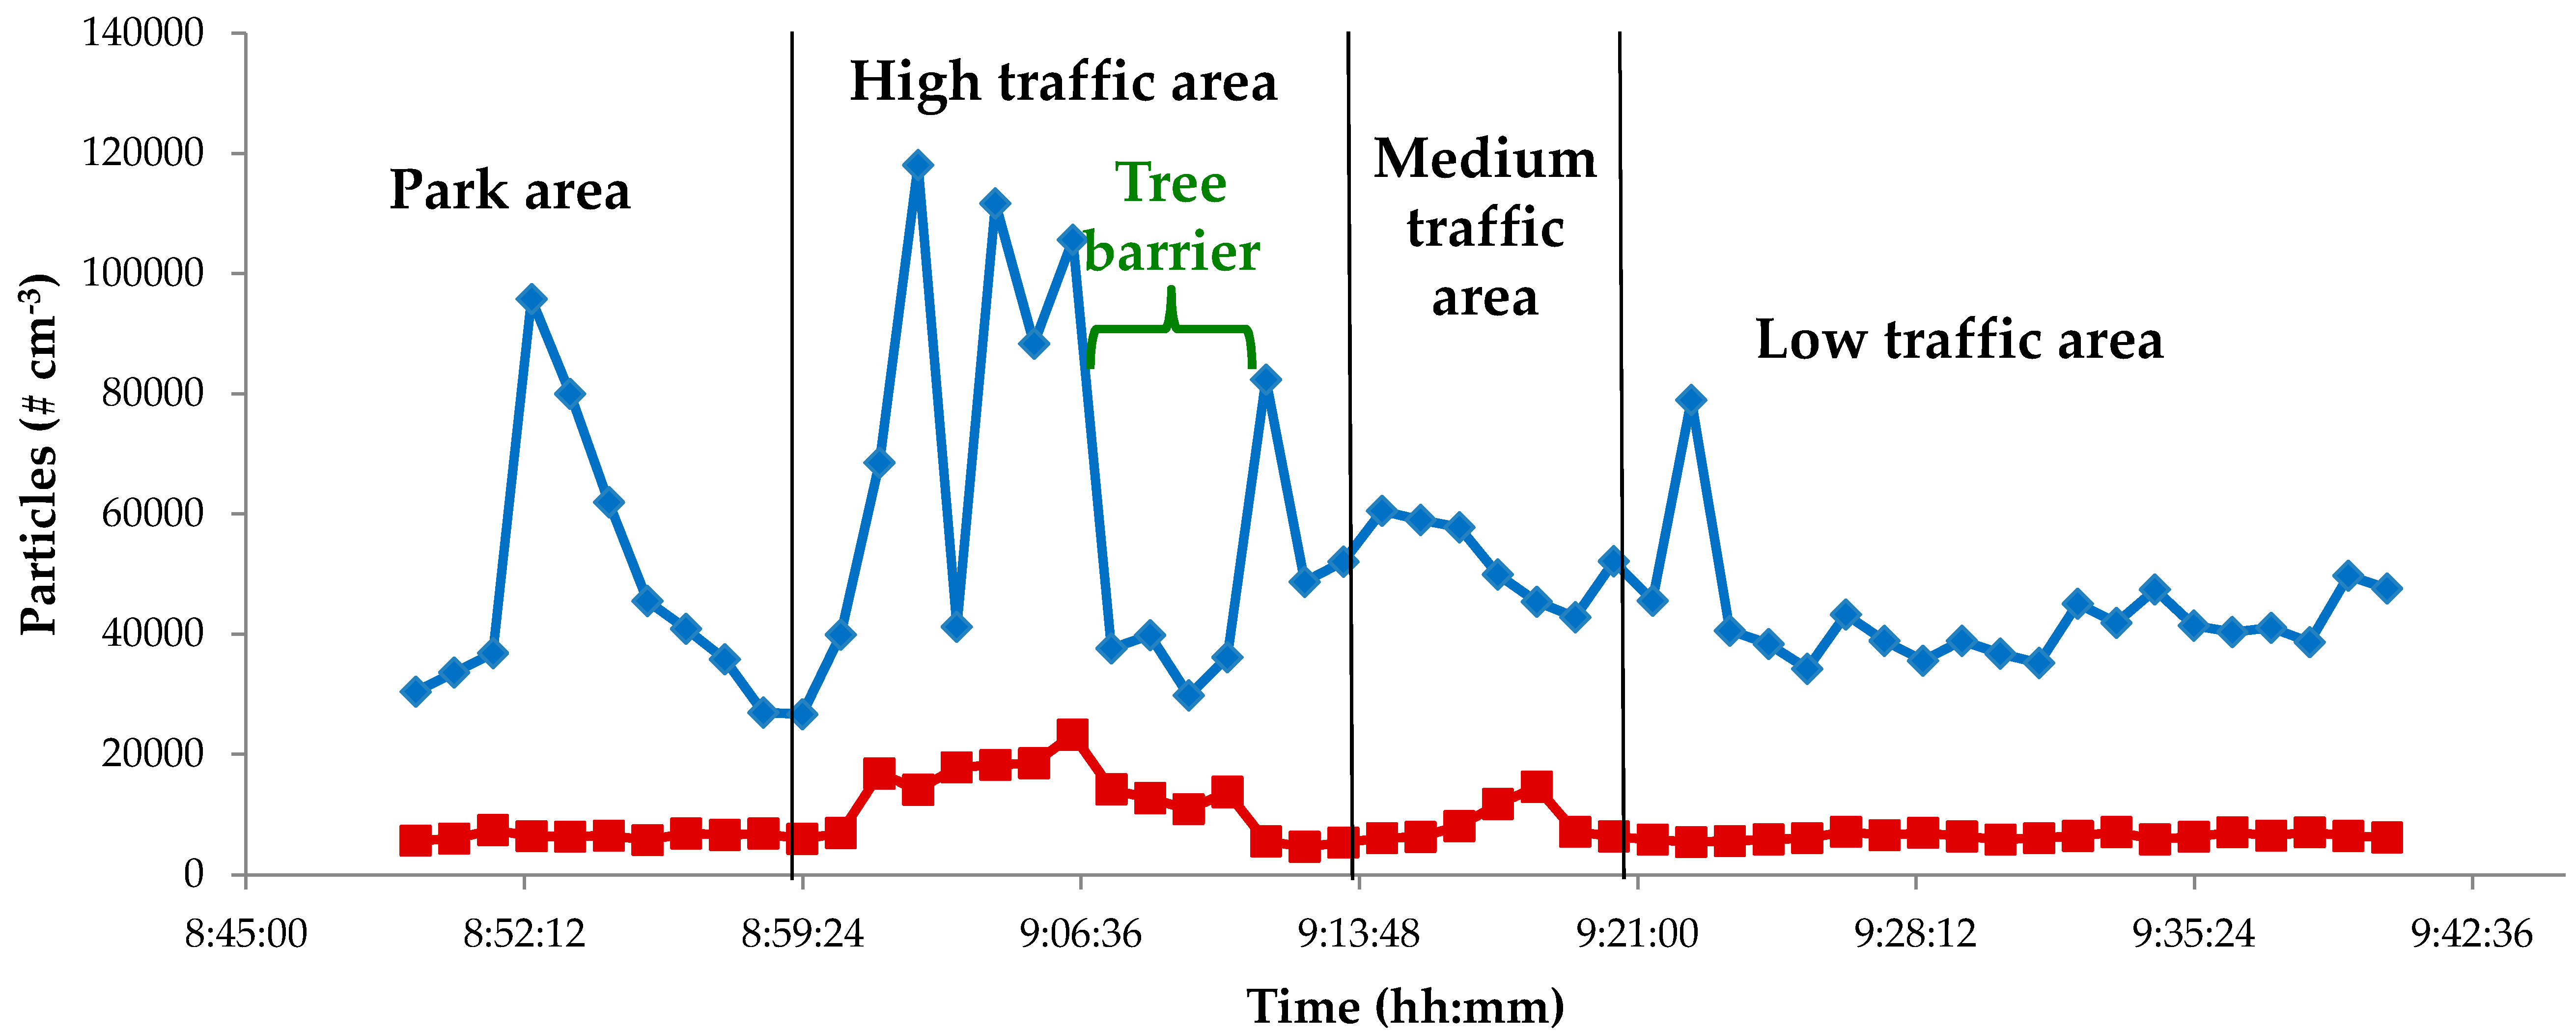
2.1. Sampling Sites
2.2. Measurement Equipment
2.3. Dosimetry Calculations
3. Results
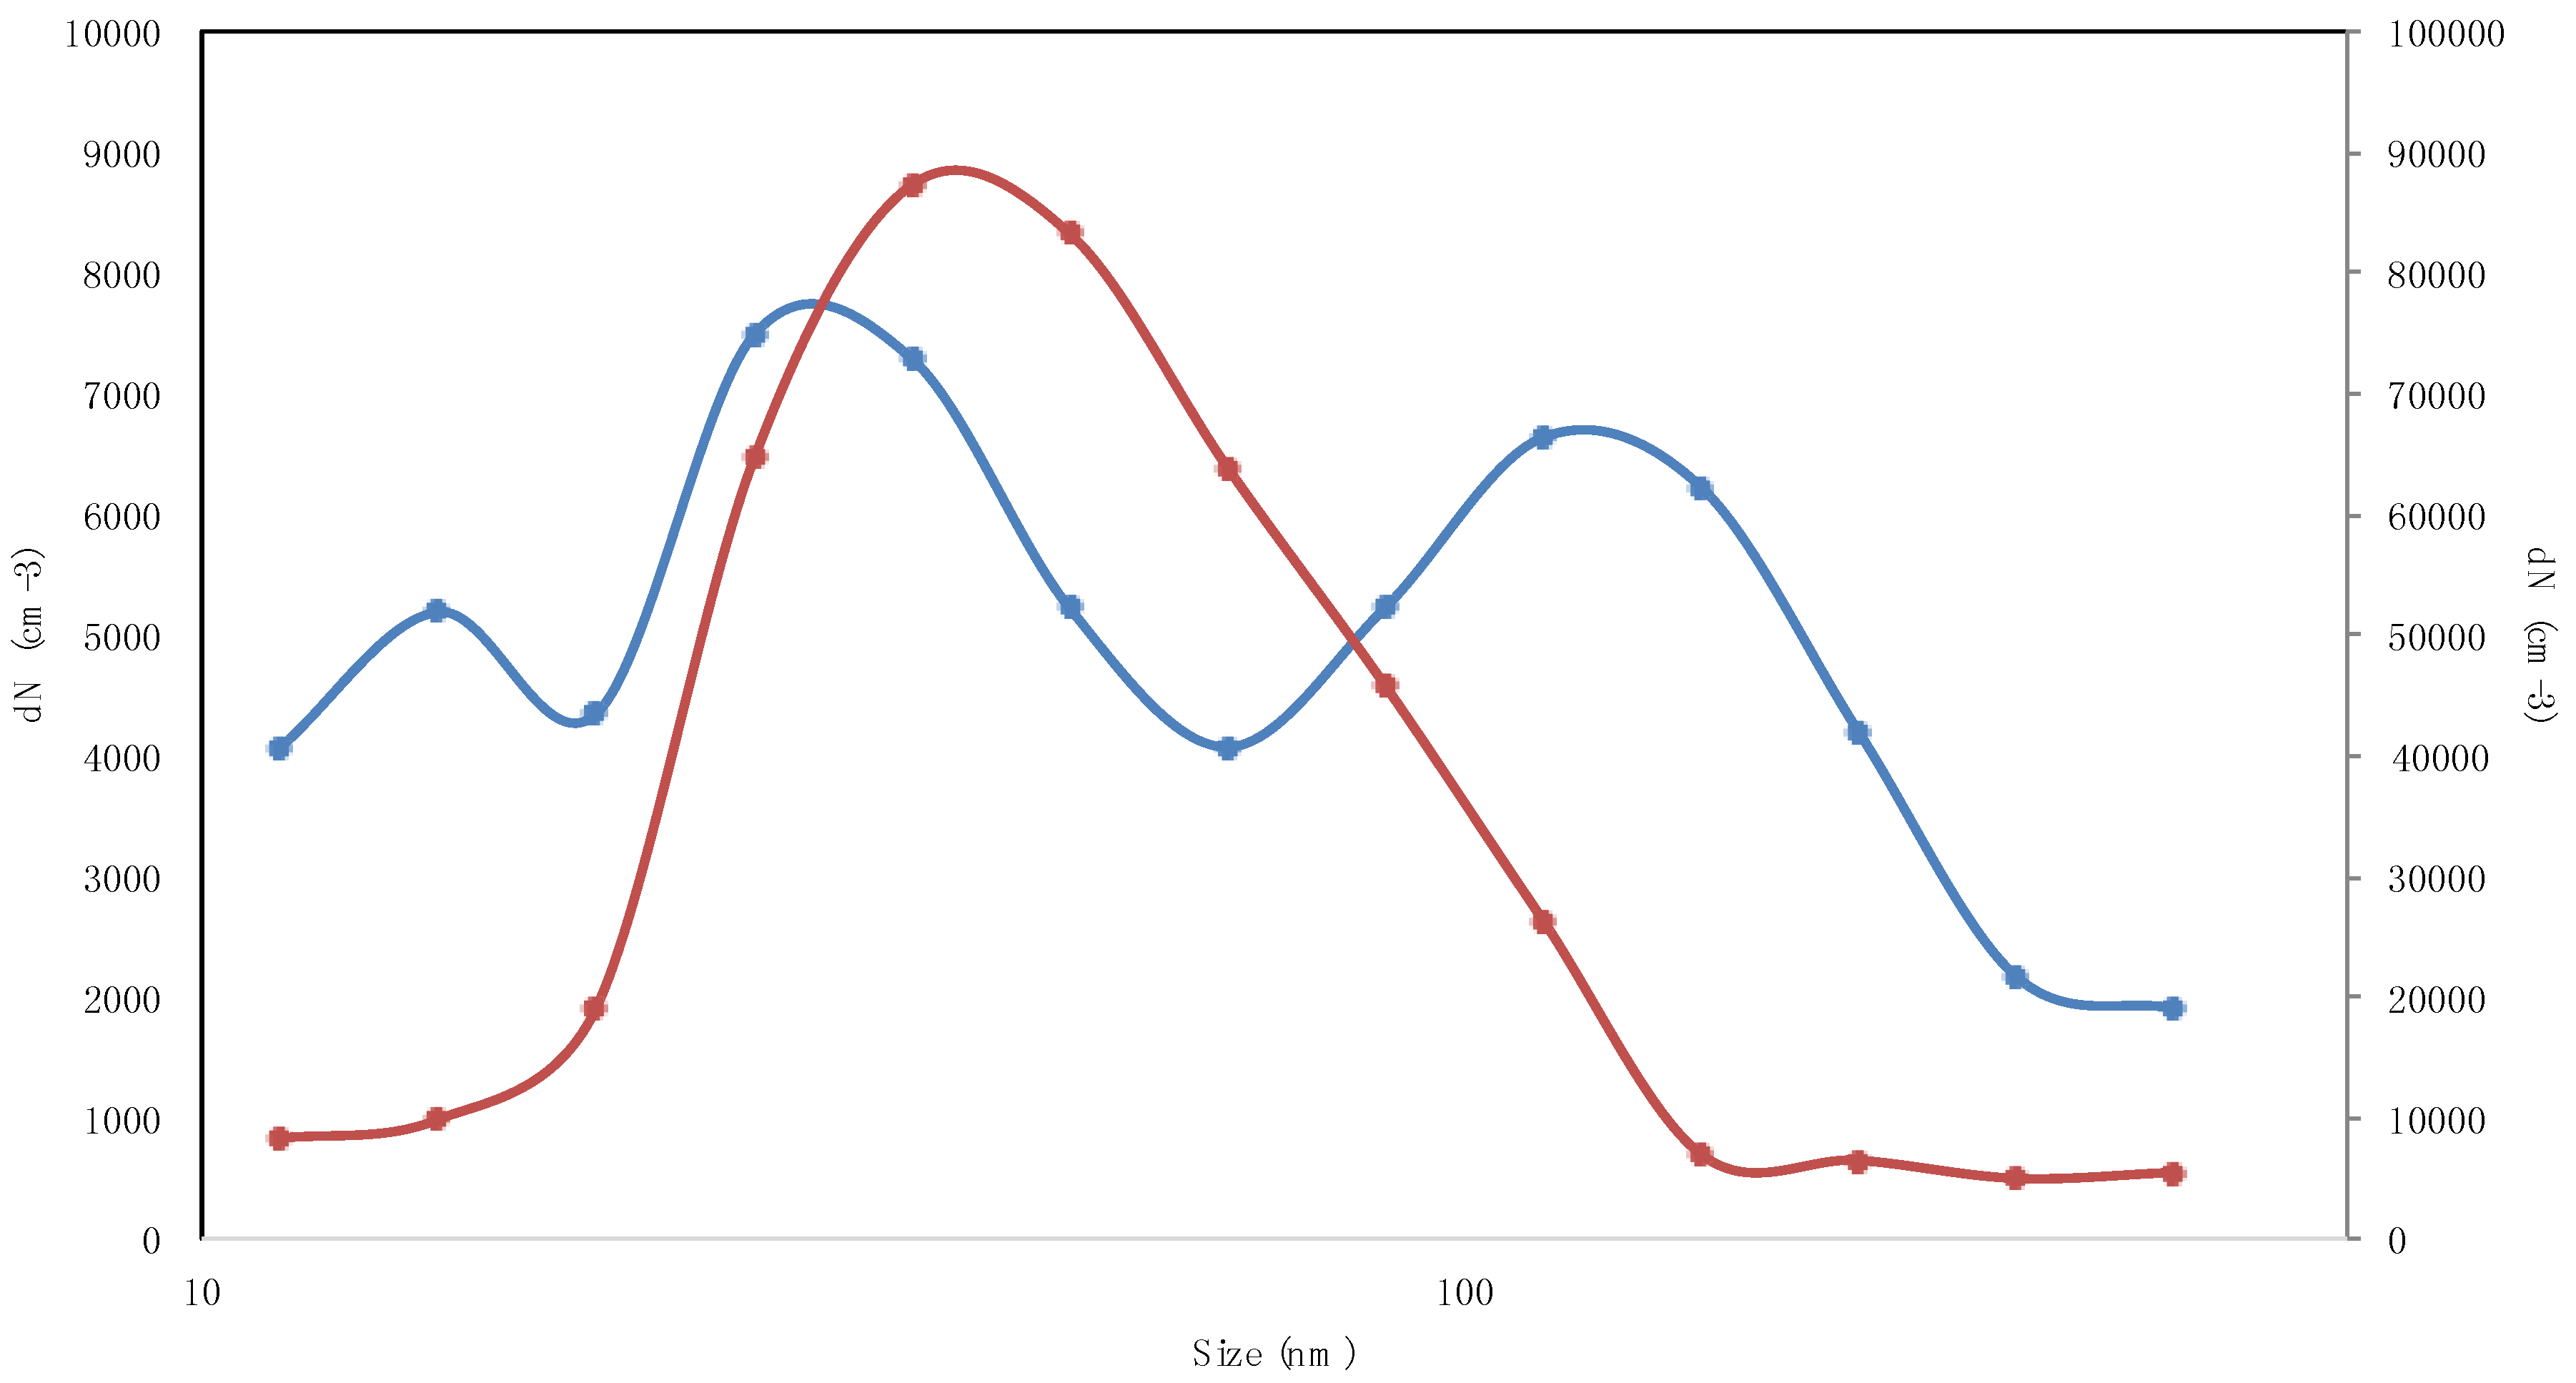
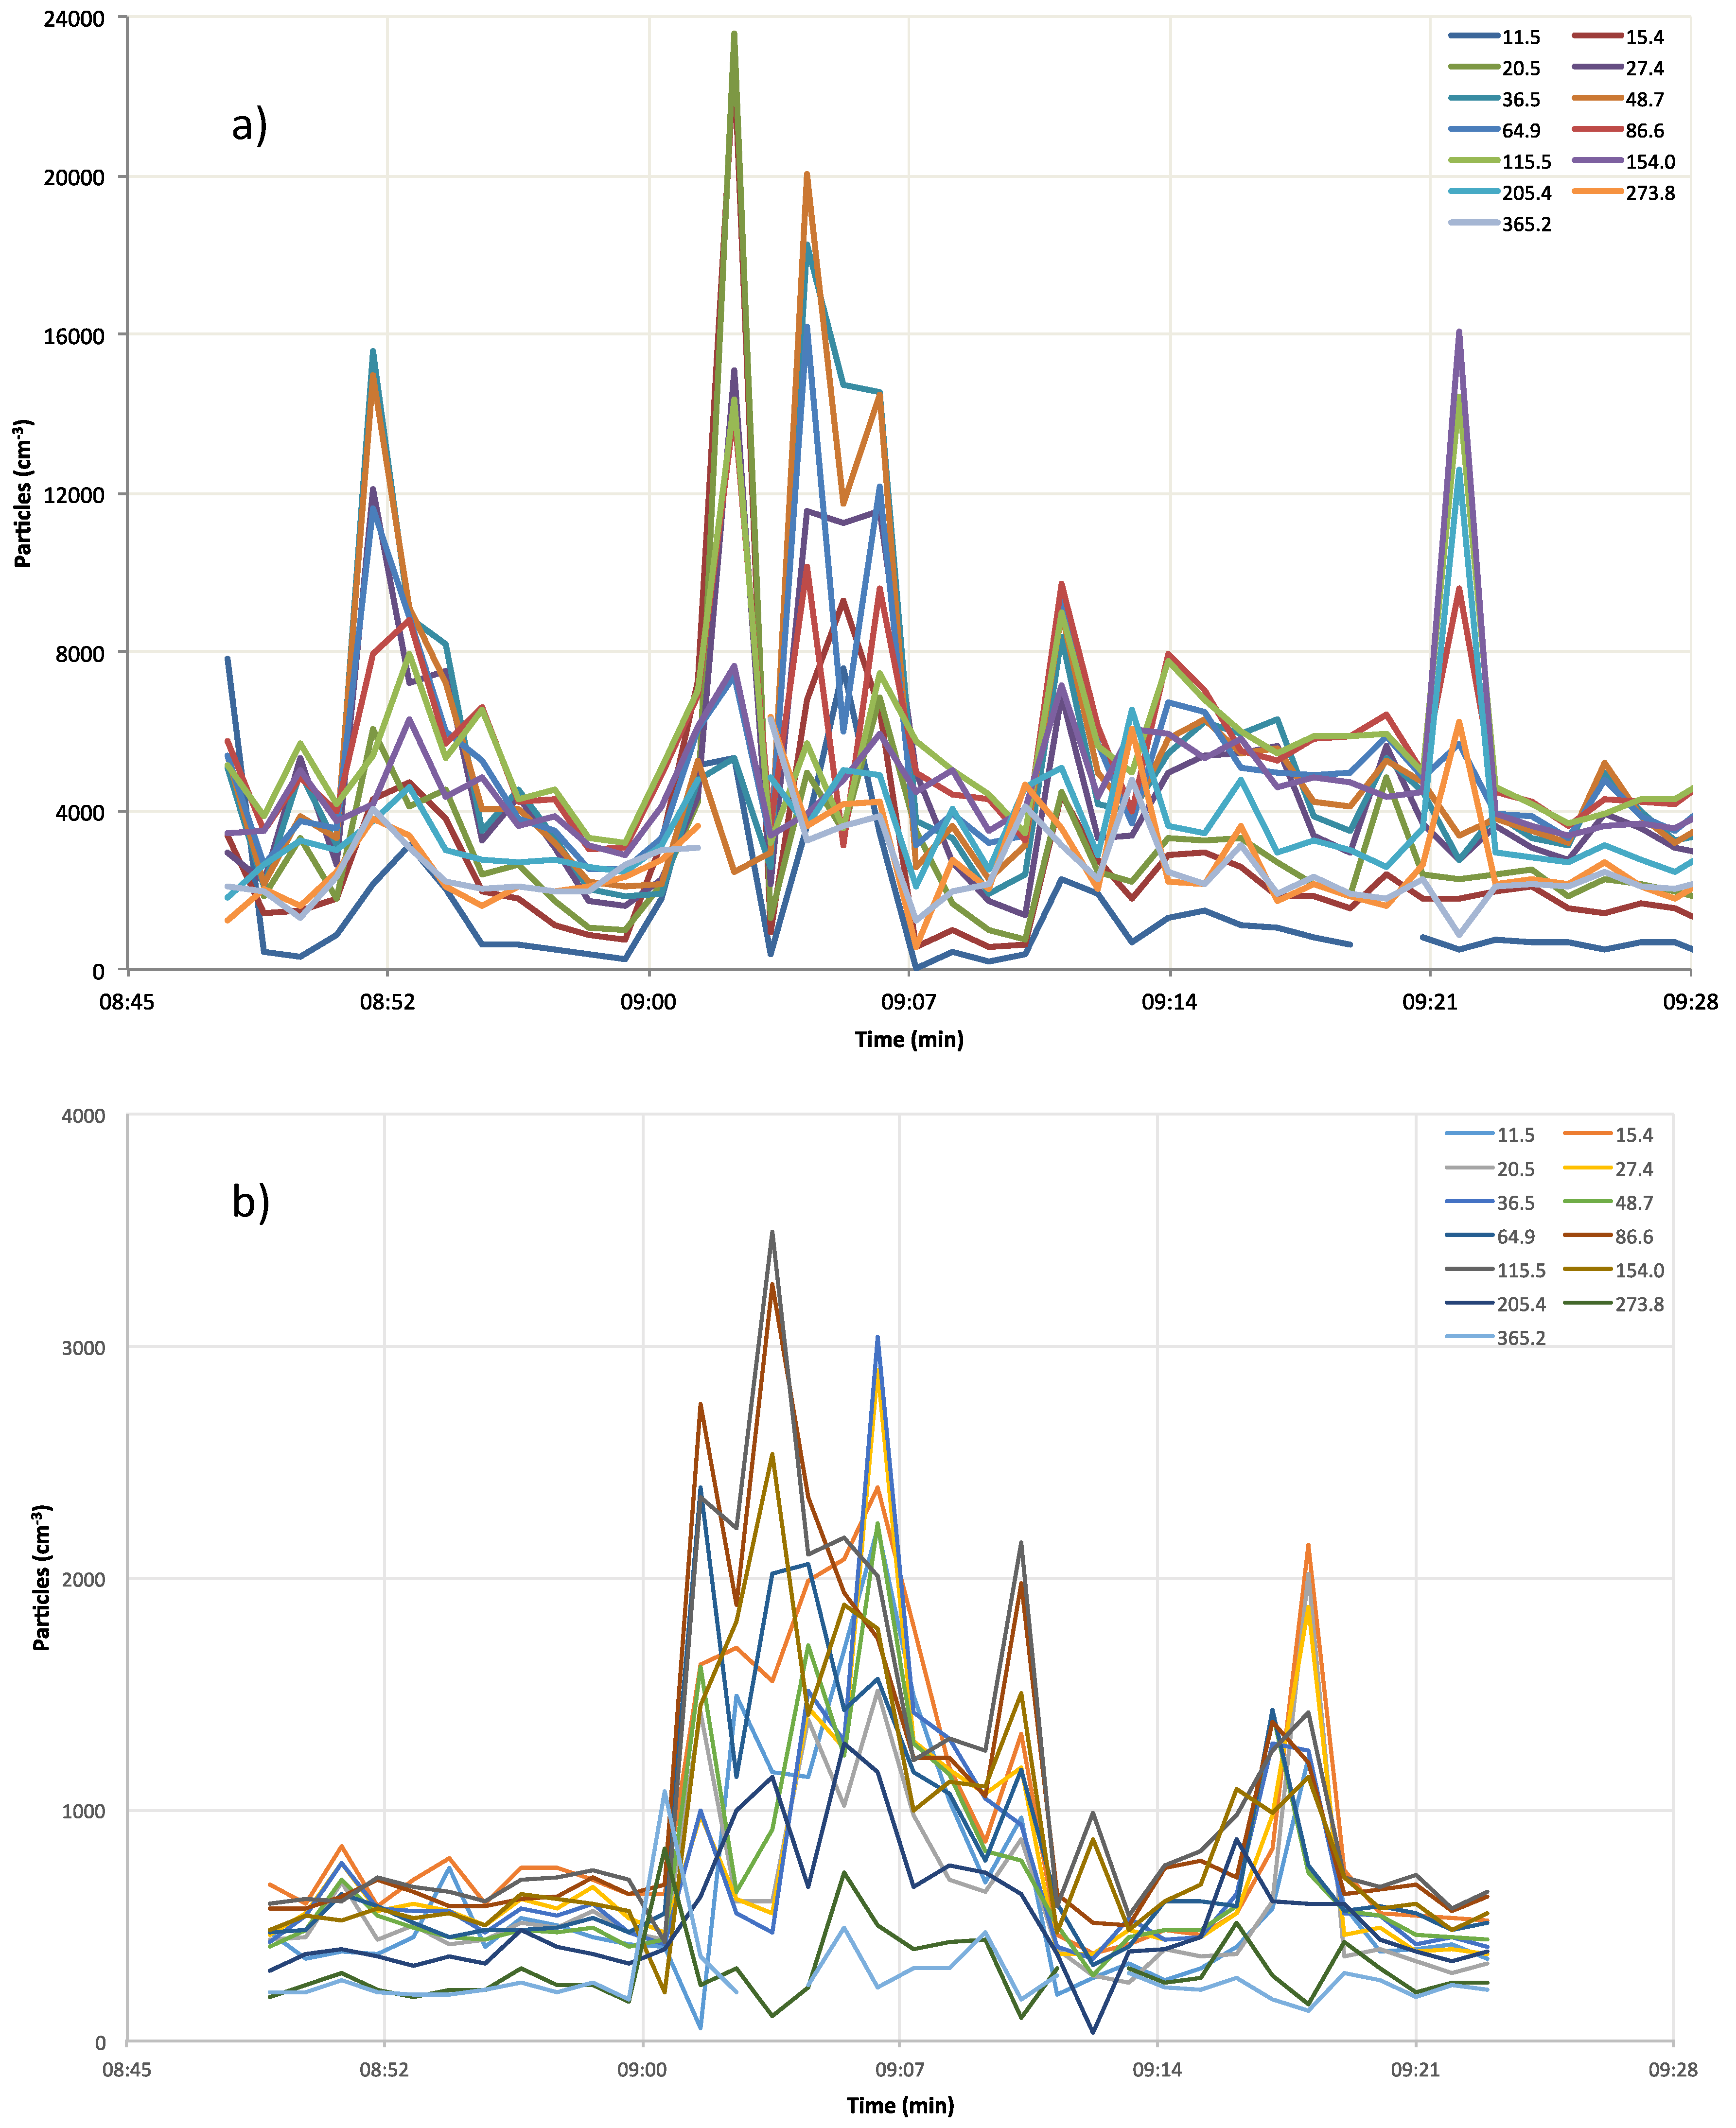
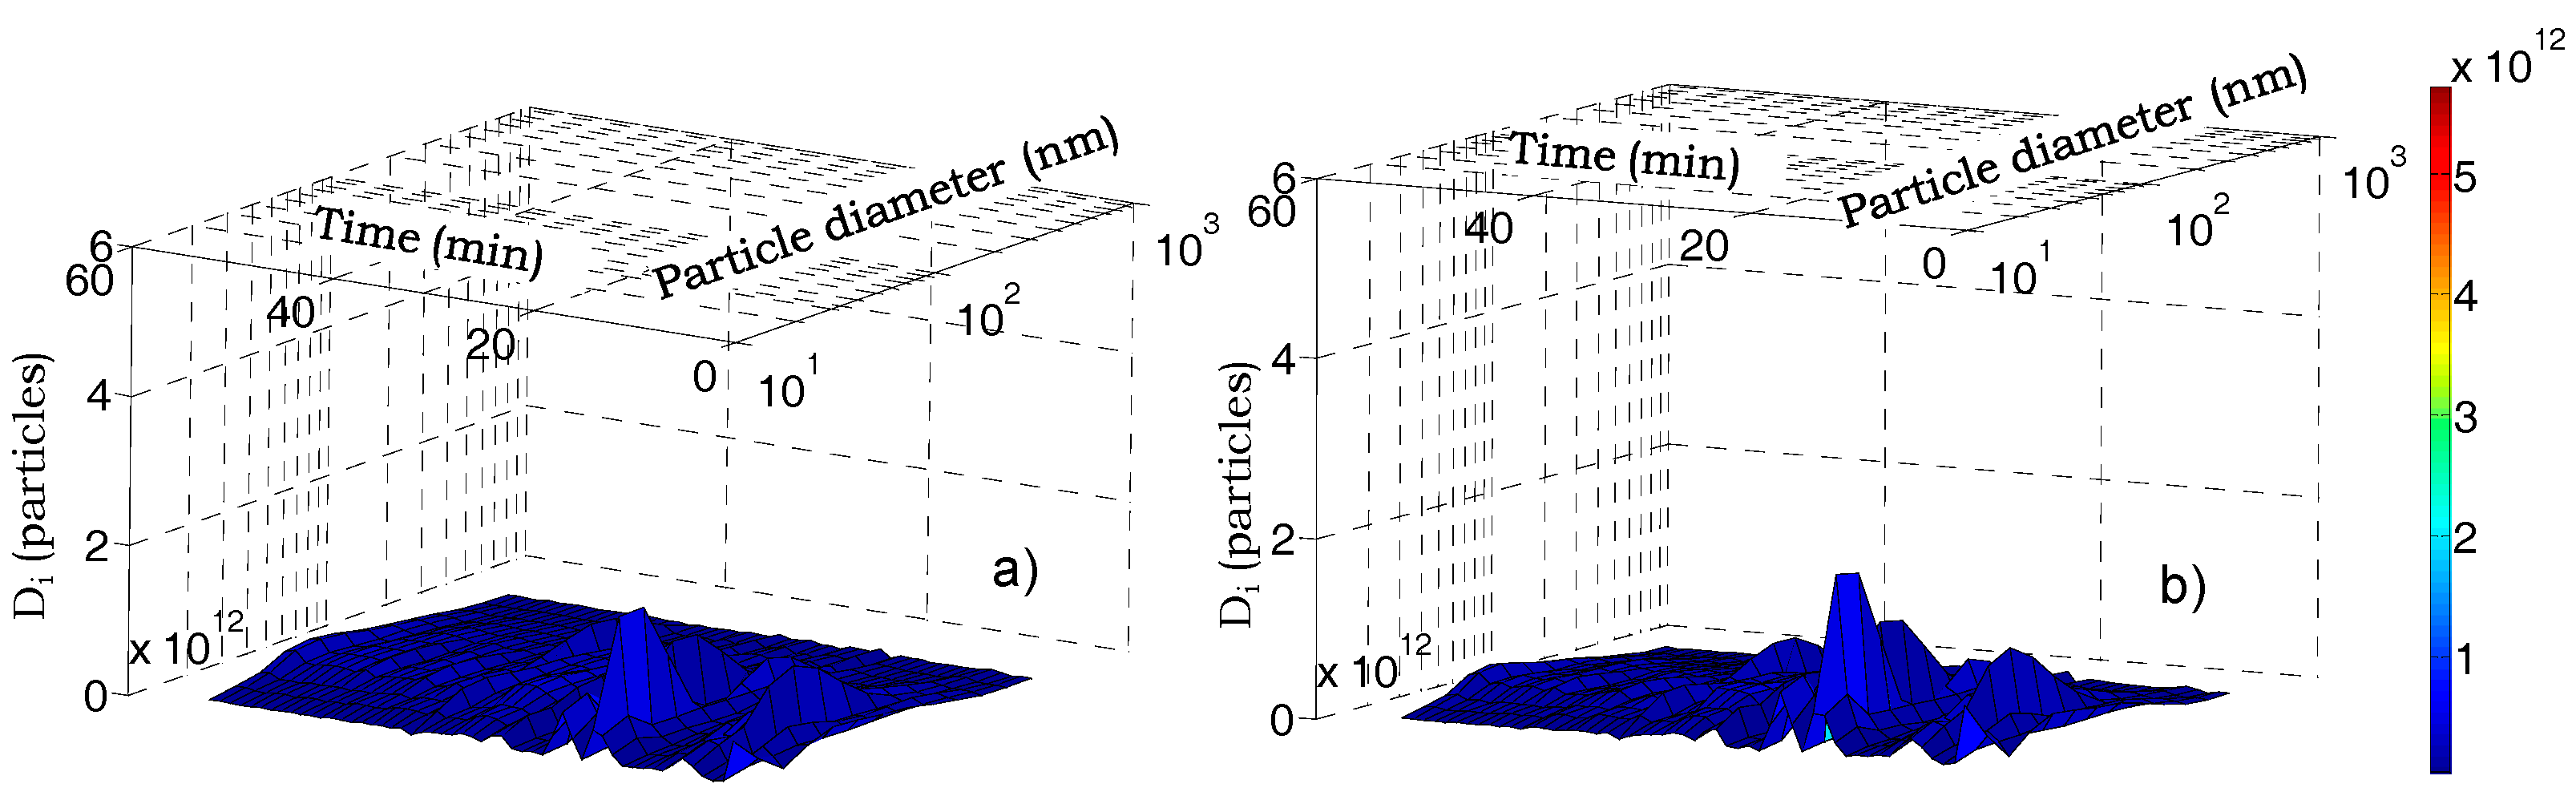
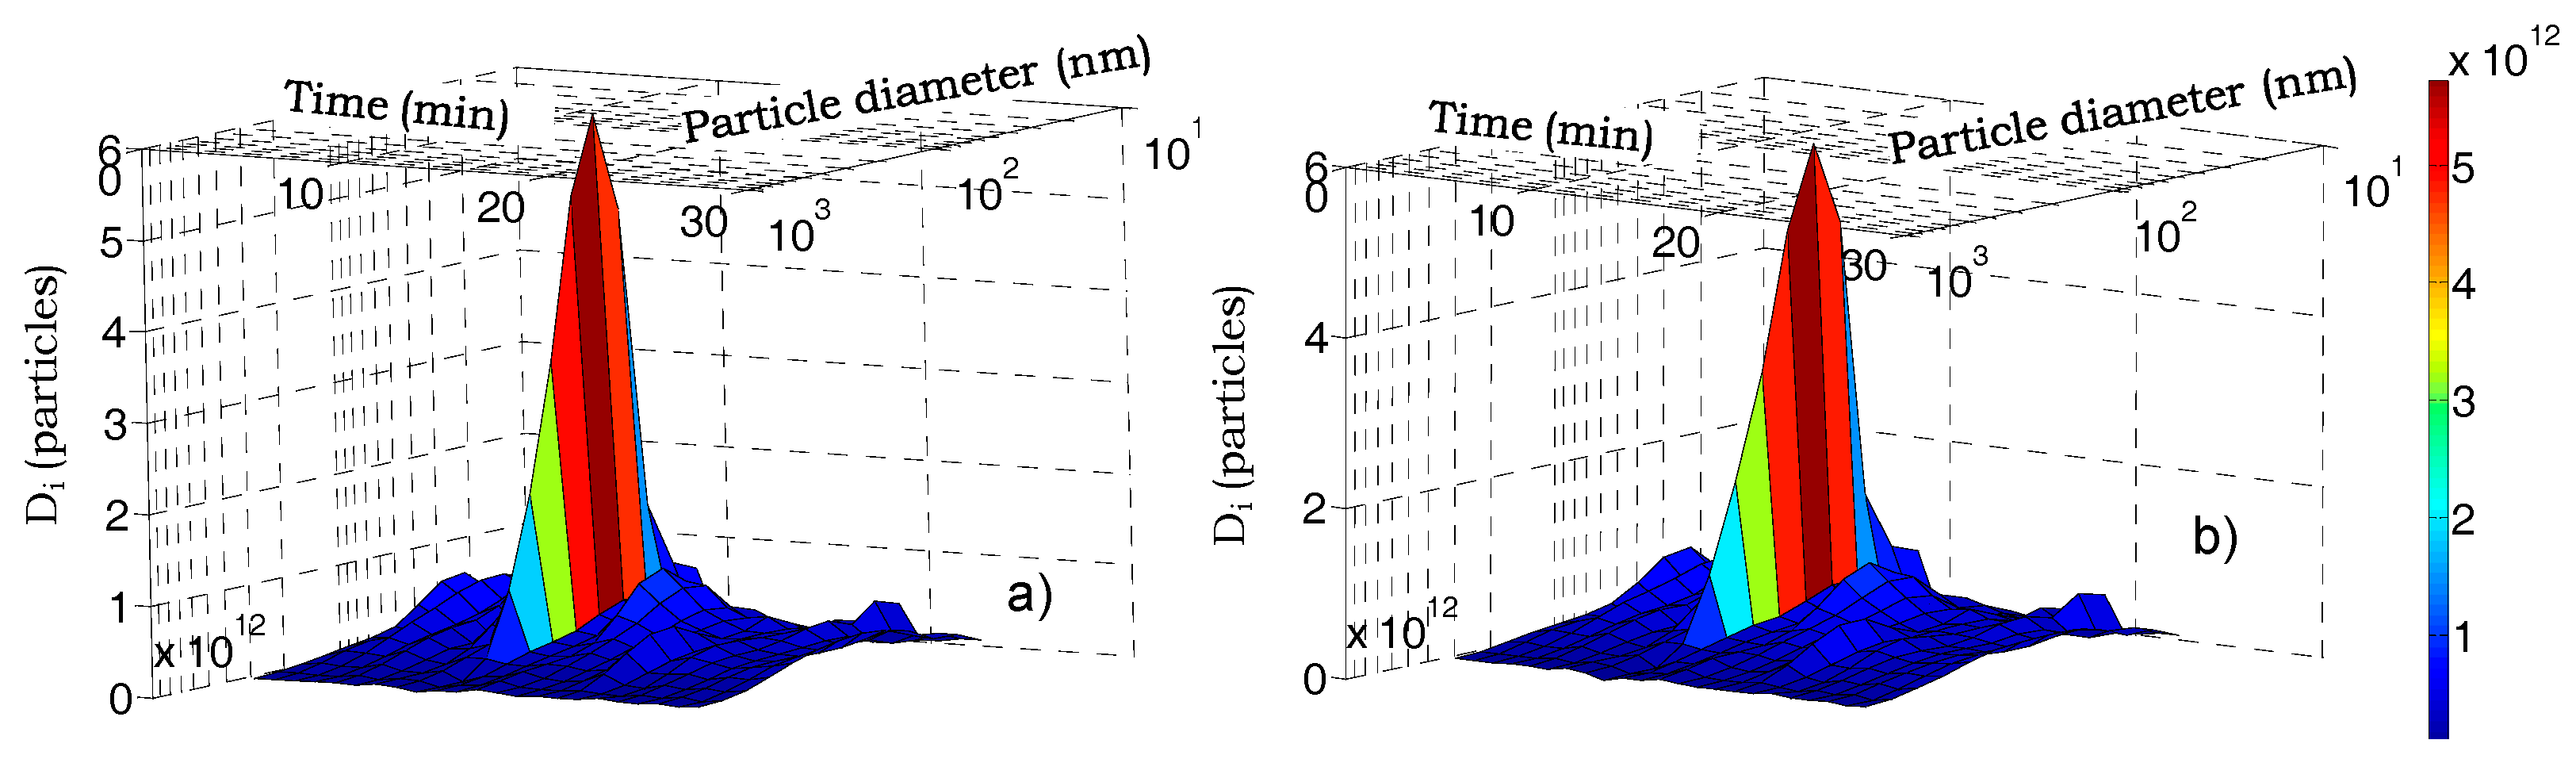
3.1. Aerosol Number Size Distributions
City Path Analysis
3.2. Dose Deposited in the Human Respiratory Tract
4. Conclusions
Acknowledgments
Author Contributions
Conflicts of Interest
References
- World Health Organization (WHO). Ambient (Outdoor) Air Quality and Health. Fact Sheet Updated September 2016. Available online: http://www.who.int/mediacentre/factsheets/fs313/en/ (accessed on 10 February 2017).
- Hoek, G.; Boogaard, H.; Knol, A.; de Hartog, J.; Slottje, P.; Ayres, J.G.; Borm, P.; Brunekreef, B.; Donaldson, K.; Forastiere, F.; et al. Concentration response functions for ultrafine particles and all-cause mortality and hospital admissions: Results of a European expert panel elicitation. Environ. Sci. Technol. 2010, 44, 476–482. [Google Scholar] [CrossRef] [PubMed]
- Du, Y.; Xu, X.; Chu, M.; Guo, Y.; Wang, J. Air particulate matter and cardiovascular disease: The epidemiological, biomedical and clinical evidence. J. Thorac. Dis. 2016, 8, E8–E19. [Google Scholar] [PubMed]
- Heusinkveld, H.J.; Wahle, T.; Campbell, A.; Westerink, R.H.; Tran, L.; Johnston, H.; Stone, V.; Cassee, F.R.; Schins, R.P. Neurodegenerative and neurological disorders by small inhaled particles. Neurotoxicology 2016, 56, 94–106. [Google Scholar] [CrossRef] [PubMed]
- Chen, R.; Hu, B.; Liu, Y.; Xu, J.; Yang, G.; Xu, D.; Chen, C. Beyond PM2.5: The role of ultrafine particles on adverse health effects of air pollution. Biochim. Biophys. Acta 2016, 1860, 2844–2855. [Google Scholar] [CrossRef] [PubMed]
- Donaldson, K.; Stone, V.; Clouter, A.; Renwick, L.; MacNee, W. Ultrafine particles. Occup. Environ. Med. 2001, 58, 211–216. [Google Scholar] [CrossRef] [PubMed]
- Li, N.; Sioutas, C.; Cho, A.; Schmitz, D.; Misra, C.; Sempf, J.; Wang, M.; Oberley, T.; Froines, J.; Nel, A. Ultrafine particulate pollutants induce oxidative stress and mitochondrial damage. Environ. Health Perspect. 2003, 11, 455–460. [Google Scholar] [CrossRef]
- Pagano, P.; De Zaiacomo, T.; Scarcella, E.; Bruni, S.; Calamosca, M. Mutagenic activity of total and particle-sized fractions of urban particulate matter. Environ. Sci. Technol. 1996, 30, 3512–3516. [Google Scholar] [CrossRef]
- Lodovici, M.; Bigagli, E. Oxidative stress and air pollution exposure. J. Toxicol. 2011, 2011, 487074. [Google Scholar] [CrossRef] [PubMed]
- Brauer, M.; Koutrakis, P.; Spengler, J.D. Personal exposures to acidic aerosols and gases. Environ. Sci. Technol. 1989, 23, 1408–1412. [Google Scholar] [CrossRef]
- Sioutas, C.; Delfino, R.J.; Singh, M. Exposure assessment for atmospheric ultrafine particles (UFPs) and implications in epidemiologic research. Environ. Health Perspect. 2005, 113, 947–955. [Google Scholar] [CrossRef] [PubMed]
- Kumar, S.; Verma, M.K.; Srivastava, A.K. Ultrafine particles in urban ambient air and their health perspectives. Rev. Environ. Health 2013, 28, 117–128. [Google Scholar] [CrossRef] [PubMed]
- Avino, P.; Protano, C.; Vitali, M.; Manigrasso, M. Benchmark study on fine-mode aerosol in a big urban area and relevant doses deposited in the human respiratory tract. Environ. Pollut. 2016, 216, 530–537. [Google Scholar] [CrossRef] [PubMed]
- Leoni, C.; Hovorka, J.; Dočekalová, V.; Cajthaml, T.; Marvanová, S. Source Impact Determination using airborne and ground measurements of industrial plumes. Environ. Sci. Technol. 2016, 50, 9881–9888. [Google Scholar] [CrossRef] [PubMed]
- Moreno, T.; Reche, C.; Rivas, I.; Cruz Minguillón, M.; Martins, V.; Vargas, C.; Buonanno, G.; Parga, J.; Pandolfi, M.; Brines, M.; et al. Urban air quality comparison for bus, tram, subway and pedestrian commutes in Barcelona. Environ. Res. 2015, 142, 495–510. [Google Scholar] [CrossRef] [PubMed]
- Adams, H.S.; Nieuwenhuijsen, M.J.; Colvile, R.N.; McMulle, M.A.; Khandelwal, P. Fine particle (PM2.5) personal exposure levels in transport microenvironments. Sci. Total Environ. 2001, 279, 29–44. [Google Scholar] [CrossRef]
- Hammond, D.; Jones, S.; Lalor, M. In-vehicle measurement of ultrafine particles on compressed natural gas, conventional diesel, and oxidation-catalyst diesel heavy-duty transit buses. Environ. Monit. Assess. 2006, 125, 239–246. [Google Scholar] [CrossRef] [PubMed]
- Kaur, S.; Clark, R.; Walsh, P.; Arnold, S.J.; Colvile, R.N.; Nieuwenhuijsen, M. Exposure visualisation of ultrafine particle counts in a transport microenvironment. Atmos. Environ. 2006, 40, 386–398. [Google Scholar] [CrossRef]
- Kaur, S.; Nieuwenhuijsen, M.J.; Colvile, R.N. Fine particulate matter and carbon monoxide exposure concentrations in urban street transport microenvironments. Atmos. Environ. 2007, 41, 4781–4810. [Google Scholar] [CrossRef]
- Kaur, S.; Nieuwenhuijsen, M.J. Determinants of personal exposure to PM2.5, ultrafine particle counts, and CO in a transport microenvironment. Environ. Sci. Technol. 2009, 43, 4737–4743. [Google Scholar] [CrossRef] [PubMed]
- Moreno, T.; Querol, X.; Alastuey, A.; Viana, M.; Gibbons, W. Profiling transient daytime peaks in urban air pollutants: City centre traffic hotspot versus urban background concentrations. J. Environ. Monit. 2009, 11, 1535–1542. [Google Scholar] [CrossRef] [PubMed]
- Zuurbier, M.; Hoek, G.; Oldenwening, M.; Lenters, V.; Meliefste, K.; van den Hazel, P.; Brunekreef, B. Commuters’ exposure to particulate matter air pollution is affected by mode of transport, Fuel type, and route. Environ. Health Perspect. 2010, 118, 783–789. [Google Scholar] [CrossRef] [PubMed]
- Knibbs, L.D.; Cole-Hunter, T.; Morawska, L. A review of commuter exposure to ultrafine particles and its health effects. Atmos. Environ. 2011, 45, 2611–2622. [Google Scholar] [CrossRef] [Green Version]
- De Nazelle, N.; Seto, E.; Donaire-Gonzalez, D.; Mendez, M.; Matamala, J.; Nieuwenhuijsen, M.; Jerrett, M. Improving estimates of air pollution exposure through ubiquitous sensing technologies. Environ. Pollut. 2012, 176, 92–99. [Google Scholar] [CrossRef] [PubMed]
- Kingham, S.; Longley, I.; Salmond, J.; Pattinson, W.; Shrestha, K. Variations in exposure to traffic pollution while travelling by different modes in a low density, less congested city. Environ. Pollut. 2013, 181, 211–218. [Google Scholar] [CrossRef] [PubMed]
- Karanasiou, A.; Viana, M.; Querol, X.; Moreno, T.; de Leeuw, F. Assessment of personal exposure to particulate air pollution during commuting in European cities—Recommendations and policy implications. Sci. Total Environ. 2014, 490, 785–797. [Google Scholar] [CrossRef] [PubMed]
- Gu, J.; Kraus, U.; Schneider, A.; Hampel, R.; Pitz, M.; Breitner, S.; Wolf, K.; Hänninen, O.; Peters, A.; Cyrys, J. Personal day-time exposure to ultrafine particles in different microenvironments. Int. J. Hyg. Environ. Health 2015, 218, 188–195. [Google Scholar] [CrossRef] [PubMed]
- Liu, W.; Ma, C.; Liu, I.; Han, B.; Chuang, H.; Chuang, K. Effects of commuting mode on air pollution exposure and cardiovascular health among young adults in Taipei, Taiwan. Int. J. Hyg. Environ. Health 2015, 218, 319–323. [Google Scholar] [CrossRef] [PubMed]
- Avino, P.; Manigrasso, M.; Carrai, P.; Rocchi, C.; Guerriero, E.; Russo, M.V. Ultrafine particles and chemical risk in automobile repair shops. Fresenius Environ. Bull. 2014, 23, 2956–2966. [Google Scholar]
- Stabile, L.; Buonanno, G.; Avino, P.; Fuoco, F.C. Dimensional and chemical characterization of airborne particles in schools: Respiratory effects in children. Aerosol Air Qual. Res. 2013, 13, 887–900. [Google Scholar] [CrossRef]
- Avino, P.; Lopez, F.; Manigrasso, M. Regional deposition of submicrometer aerosol in the human respiratory system determined at 1-s time resolution of particle size distribution measurements. Aerosol Air Qual. Res. 2013, 13, 1702–1711. [Google Scholar] [CrossRef]
- Avino, P.; Manigrasso, M.; Pandolfi, P.; Tornese, C.; Settimi, D.; Paolucci, N. Submicron particles during macro- and micro-weldings procedures in industrial indoor environments and health implications for welding operators. Metals 2015, 5, 1045–1060. [Google Scholar] [CrossRef]
- Manigrasso, M.; Buonanno, G.; Fuoco, F.C.; Stabile, L.; Avino, P. Aerosol deposition doses in the human respiratory tree of electronic cigarette smokers. Environ. Pollut. 2015, 196, 257–267. [Google Scholar] [CrossRef] [PubMed]
- Manigrasso, M.; Buonanno, G.; Stabile, L.; Morawska, L.; Avino, P. Particle doses in the pulmonary lobes of electronic and conventional cigarette users. Environ. Pollut. 2015, 202, 24–31. [Google Scholar] [CrossRef] [PubMed]
- Manigrasso, M.; Vitali, M.; Protano, C.; Avino, P. Temporal evolution of ultrafine particles and of alveolar deposited surface area from main indoor combustion and non-combustion sources in a model room. Sci. Total Environ. 2017. [Google Scholar] [CrossRef]
- Manigrasso, M.; Vernale, C.; Avino, P. Traffic aerosol lobar doses deposited in the human respiratory system. Environ. Sci. Poll. Res. 2016. [Google Scholar] [CrossRef] [PubMed]
- Anjilvel, S.; Asgharian, B.A. Multiple-path model of particle deposition in the rat lung. Fundam. Appl. Toxicol. 1995, 28, 41–50. [Google Scholar] [CrossRef] [PubMed]
- Price, O.T.; Asgharian, B.; Miller, F.J.; Cassee, F.R.; de Winter-Sorkina, R. Multiple Path Particle Dosimetry Model (MPPD v. 1.0): A Model for Human and Rat Airway Particle Dosimetry. Available online: http://www.ara.com/products/mppd.htm (accessed on 23 November 2016).
- International Commission on Radiological Protection. Human Respiratory Tract Model for Radiological Protection. Available online: http://www.icrp.org/publication.asp?id=ICRP%20 Publication%2066 (accessed on 23 November 2016).
- Asgharian, B.; Hofmann, W.; Bergmann, R. Particle deposition in a multiple-path model of the human lung. Aerosol Sci. Technol. 2001, 34, 332–339. [Google Scholar] [CrossRef]
- Londahl, J.; Swietlicki, E.; Rissler, J.; Bengtsson, A.; Boman, C.; Blomberg, A.; Sandstrom, T. Experimental determination of the respiratory tract deposition of diesel combustion particles in patients with chronic obstructive pulmonary disease. Part. Fibre Toxicol. 2012, 9, 30. [Google Scholar] [CrossRef] [PubMed]
- De Boor, C. A Practical Guide to Splines; Springer: New York, NY, USA, 1978. [Google Scholar]
- Avino, P.; De Lisio, V.; Grassi, M.; Lucchetta, M.C.; Messina, B.; Monaco, G.; Petraccia, L.; Quartieri, G.; Rosentzwig, R.; Russo, M.V.; et al. Influence of air pollution on chronic obstructive respiratory diseases: Comparison between city (Rome) and hillcountry environments and climates. Ann. Chim. 2004, 94, 629–636. [Google Scholar] [CrossRef] [PubMed]
- Perrino, C.; Catrambone, M.; Pietrodangelo, A. Influence of atmospheric stability on the mass concentration and chemical composition of atmospheric particles: A case study in Rome, Italy. Environ. Int. 2008, 34, 621–628. [Google Scholar] [CrossRef] [PubMed]
- Avino, P.; Capannesi, G.; Rosada, A. Heavy metal determination in atmospheric particulate matter by Instrumental Neutron Activation Analysis. Microchem. J. 2008, 88, 97–106. [Google Scholar] [CrossRef]
- Fanizza, C.; Casciardi, S.; Avino, P.; Manigrasso, M. Measurements and characterization by transmission electron microscopy of ultrafine particles in the urban air of Rome. Fresenius Environ. Bull. 2010, 19, 2026–2032. [Google Scholar]
- Avino, P.; Brocco, D.; Lepore, L.; Pareti, S. Interpretation of atmospheric pollution phenomena in relationship with the vertical atmospheric remixing by means of natural radioactivity measurements (radon) of particulate matter. Ann. Chim. 2002, 93, 589–594. [Google Scholar]
- Avino, P.; Capannesi, G.; Rosada, A. Characterization and distribution of mineral content in fine and coarse airborne particle fractions by neutron activation analysis. Toxicol. Environ. Chem. 2006, 88, 633–647. [Google Scholar] [CrossRef]
- Manigrasso, M.; Avino, P. Fast evolution of urban ultrafine particles: Implications for deposition doses in the human respiratory system. Atmos. Environ. 2012, 51, 116–123. [Google Scholar] [CrossRef]
- Avino, P.; Manigrasso, M. Dynamic of submicrometer particles in urban environment. Environ. Sci. Pollut. Res. Int. 2016. [Google Scholar] [CrossRef] [PubMed]
- Morawska, L.; Thomas, S.; Bofinger, N.; Wainwright, D.; Neale, D. Comprehensive characterization of aerosols in a subtropical urban atmosphere: Particle size distribution and correlation with gaseous pollutants. Atmos. Environ. 1998, 32, 2467–2478. [Google Scholar] [CrossRef]
- Wichmann, H.E.; Spix, C.; Tuch, T.; Wölke, G.; Peters, A.; Heinrich, J.; Kreyling, W.G.; Heyder, J. Daily mortality and fine and ultrafine particles in Erfurt, Germany part I: Role of particle number and particle mass. Res. Rep. Health Effects Inst. 2000, 98, 5–94. [Google Scholar]
- Rodríguez, S.; Van Dingenen, R.; Putaud, J.-P.; Dell’Acqua, A.; Pey, J.; Querol, X.; Alastuey, A.; Chenery, S.; Ho, K.-F.; Harrison, R.; et al. A study on the relationship between mass concentrations, chemistry and number size distribution of urban fine aerosols in Milan, Barcelona and London. Atmos. Chem. Phys. 2007, 7, 2217–2232. [Google Scholar] [CrossRef]
- Pietikäinen, M.; Oravisjärvi, K.; Rautio, A.; Voutilainen, A.; Ruuskanen, J.; Keiski, R.L. Exposure assessment of particulates of diesel and natural gas fuelled buses in silico. Sci. Total Environ. 2009, 408, 163–168. [Google Scholar] [CrossRef] [PubMed]
- Marini, S.; Buonanno, G.; Stabile, L.; Avino, P. A benchmark for numerical scheme validation of airborne particle exposure in street canyons. Environ. Sci. Pollut. Res. 2015, 22, 2051–2063. [Google Scholar] [CrossRef] [PubMed]
- Wong, C.P.; Chan, T.L.; Leung, C.W. Characterisation of diesel exhaust particle number and size distributions using mini-dilution tunnel and ejector-diluter measurement techniques. Atmos. Environ. 2003, 37, 4435–4446. [Google Scholar] [CrossRef]
- Kittelson, D.B. Recent Measurements of Nanoparticle Emissions from Engines. Proc. Meet. Japan Ass. Aerosol Sci. Technol. Tokyo (Japan). 2001. Available online: http://www.me.umn.edu/centers/mel/reports/JAASTpaper.pdf (accessed on 19 January 2017).
- Vogt, R.; Scheer, V.; Casati, R.; Benter, T. On-road measurement of particle emission in the exhaust plume of a diesel passenger car. Environ. Sci. Technol. 2003, 37, 4070–4076. [Google Scholar] [CrossRef] [PubMed]
- Forastiere, F.; Agabiti, N. Assessing the link between air pollution and heart failure. Lancet 2013, 21, 1008–1010. [Google Scholar] [CrossRef]
- Global Burden of Disease Study 2013 Collaborators. Global, regional, and national incidence, prevalence, and years lived with disability for 301 acute and chronic diseases and injuries in 188 countries, 1990–2013: A systematic analysis for the Global Burden of Disease Study 2013. Lancet 2015, 386, 743–800. [Google Scholar]
- Vos, T.; Flaxman, A.D.; Naghavi, M.; Lozano, R.; Michaud, C.; Ezzati, M.; Shibuya, K.; Salomon, J.A.; Abdalla, S.; Aboyans, V.; et al. Years lived with disability (YLDs) for 1160 sequelae of 289 diseases and injuries 1990–2010: A systematic analysis for the Global Burden of Disease Study 2010. Lancet 2012, 380, 2163–2196. [Google Scholar] [CrossRef]
- Lomborg, B. Global Problems, Local Solutions: Costs and Benefits; Cambridge University Press: Cambridge, UK, 2013; p. 143. [Google Scholar]


| Parameter | PM1 | PM2.5 | PM4 | PM10 | Total PM |
|---|---|---|---|---|---|
| Mean | 129 | 130 | 131 | 137 | 155 |
| Median | 125 | 126 | 127 | 132 | 138 |
| Min | 98 | 98 | 99 | 100 | 100 |
| Max | 316 | 324 | 341 | 412 | 1160 |
| 60% | 128 | 129 | 130 | 135 | 145 |
| 80% | 136 | 137 | 138 | 145 | 169 |
| 95% | 154 | 155 | 157 | 168 | 239 |
| St. Dev. | 16 | 17 | 18 | 24 | 59 |
| Variability | 12 | 13 | 14 | 18 | 38 |
| Parameter | PM1 | PM2.5 | PM4 | PM10 | Total PM |
|---|---|---|---|---|---|
| Mean | 32 | 32 | 33 | 35 | 45 |
| Median | 30 | 30 | 30 | 31 | 32 |
| Min | 20 | 20 | 20 | 20 | 20 |
| Max | 251 | 252 | 252 | 283 | 1600 |
| 60% | 31 | 31 | 32 | 33 | 34 |
| 80% | 34 | 34 | 35 | 37 | 45 |
| 95% | 46 | 46 | 47 | 53 | 105 |
| St. Dev. | 11 | 11 | 12 | 17 | 50 |
| Variability | 34 | 34 | 36 | 47 | 112 |
| PM1 | PM2.5 | PM4 | PM10 | Total PM | (a) |
| 1 | 0.999 | 0.995 | 0.934 | 0.660 | PM1 |
| 1 | 0.997 | 0.943 | 0.668 | PM2.5 | |
| 1 | 0.959 | 0.686 | PM4 | ||
| 1 | 0.740 | PM10 | |||
| 1 | Total PM | ||||
| PM1 | PM2.5 | PM4 | PM10 | Total PM | (b) |
| 1 | 0.999 | 0.994 | 0.913 | 0.686 | PM1 |
| 1 | 0.996 | 0.922 | 0.692 | PM2.5 | |
| 1 | 0.946 | 0.705 | PM4 | ||
| 1 | 0.740 | PM10 | |||
| 1 | Total PM |
| Parameter | 11.5 | 15.4 | 20.5 | 27.4 | 36.5 | 48.7 | 64.9 | 86.6 | 115.5 | 154.0 | 205.4 | 273.8 | 365.2 |
| (a) | |||||||||||||
| Mean | 1344 | 2641 | 2958 | 4480 | 5083 | 5097 | 5172 | 5566 | 5531 | 4699 | 3538 | 2651 | 2464 |
| Median | 635 | 1655 | 2215 | 3403 | 3991 | 4090 | 4768 | 4950 | 5041 | 4329 | 3082 | 2253 | 2166 |
| Min | 31 | 567 | 759 | 1371 | 1829 | 2088 | 2535 | 3031 | 3187 | 2862 | 1817 | 568 | 852 |
| Max | 7818 | 22,820 | 23,579 | 15,113 | 18,271 | 20,021 | 16,193 | 14,068 | 14,399 | 16,091 | 12,613 | 6360 | 6302 |
| 60% | 691 | 1816 | 2392 | 3674 | 4505 | 4593 | 4988 | 5296 | 5347 | 4388 | 3223 | 2363 | 2286 |
| 80% | 1890 | 3110 | 3449 | 5422 | 5814 | 5621 | 5955 | 6543 | 6000 | 5195 | 3991 | 3510 | 3039 |
| 95% | 5221 | 6998 | 5466 | 11,545 | 14,619 | 12,827 | 10,256 | 9632 | 8385 | 6650 | 5033 | 5316 | 4072 |
| St. Dev. | 1729 | 3359 | 3182 | 2915 | 3473 | 3406 | 2511 | 2121 | 2143 | 1877 | 1560 | 1183 | 906 |
| Variability | 129 | 127 | 108 | 65 | 68 | 67 | 49 | 38 | 39 | 40 | 44 | 45 | 37 |
| Parameter | 11.5 | 15.4 | 20.5 | 27.4 | 36.5 | 48.7 | 64.9 | 86.6 | 115.5 | 154.0 | 205.4 | 273.8 | 365.2 |
| (b) | |||||||||||||
| Mean | 661 | 952 | 629 | 770 | 765 | 730 | 826 | 1044 | 1103 | 888 | 542 | 306 | 278 |
| Median | 446 | 697 | 472 | 562 | 551 | 500 | 582 | 674 | 713 | 611 | 412 | 253 | 232 |
| Min | 54 | 378 | 250 | 372 | 354 | 281 | 329 | 496 | 426 | 206 | 36 | 100 | 131 |
| Max | 2210 | 2386 | 2023 | 2890 | 3035 | 2231 | 2384 | 3271 | 3494 | 2531 | 1287 | 827 | 1080 |
| 60% | 508 | 765 | 531 | 601 | 574 | 569 | 602 | 727 | 882 | 775 | 521 | 290 | 250 |
| 80% | 1056 | 1567 | 732 | 1092 | 1084 | 963 | 1165 | 1453 | 1538 | 1193 | 679 | 410 | 298 |
| 95% | 1551 | 2098 | 1447 | 1568 | 1448 | 1648 | 2029 | 2465 | 2253 | 1831 | 1150 | 587 | 479 |
| St. Dev. | 484 | 575 | 401 | 517 | 521 | 449 | 523 | 699 | 711 | 520 | 274 | 156 | 163 |
| Variability | 73 | 60 | 64 | 67 | 68 | 62 | 63 | 67 | 64 | 59 | 51 | 51 | 59 |
| 11.5 | 15.4 | 20.5 | 27.4 | 36.5 | 48.7 | 64.9 | 86.6 | 115.5 | 154.0 | 205.4 | 273.8 | 365.2 | |
|---|---|---|---|---|---|---|---|---|---|---|---|---|---|
| (a) | |||||||||||||
| 1 | 0.707 | 0.590 | 0.608 | 0.561 | 0.490 | 0.488 | 0.434 | 0.285 | 0.131 | 0.091 | 0.161 | 0.265 | 11.5 |
| 1 | 0.932 | 0.793 | 0.437 | 0.322 | 0.479 | 0.703 | 0.598 | 0.283 | 0.233 | 0.310 | 0.355 | 15.4 | |
| 1 | 0.773 | 0.333 | 0.216 | 0.431 | 0.751 | 0.661 | 0.289 | 0.157 | 0.146 | 0.205 | 20.5 | ||
| 1 | 0.842 | 0.741 | 0.783 | 0.706 | 0.461 | 0.213 | 0.139 | 0.203 | 0.288 | 27.4 | |||
| 1 | 0.976 | 0.889 | 0.492 | 0.157 | 0.077 | 0.136 | 0.253 | 0.347 | 36.5 | ||||
| 1 | 0.927 | 0.486 | 0.124 | 0.068 | 0.151 | 0.277 | 0.360 | 48.7 | |||||
| 1 | 0.761 | 0.417 | 0.252 | 0.221 | 0.269 | 0.287 | 64.9 | ||||||
| 1 | 0.872 | 0.596 | 0.424 | 0.228 | 0.040 | 86.6 | |||||||
| 1 | 0.861 | 0.717 | 0.294 | −0.202 | 115.5 | ||||||||
| 1 | 0.909 | 0.508 | −0.125 | 154.0 | |||||||||
| 1 | 0.806 | 0.213 | 205.4 | ||||||||||
| 1 | 0.727 | 273.8 | |||||||||||
| 1 | 365.2 | ||||||||||||
| (b) | |||||||||||||
| 11.5 | 15.4 | 20.5 | 27.4 | 36.5 | 48.7 | 64.9 | 86.6 | 115.5 | 154.0 | 205.4 | 273.8 | 365.2 | |
| 1 | 0.867 | 0.613 | 0.787 | 0.765 | 0.654 | 0.509 | 0.547 | 0.631 | 0.719 | 0.790 | 0.276 | −0.063 | 11.5 |
| 1 | 0.883 | 0.836 | 0.777 | 0.795 | 0.765 | 0.765 | 0.777 | 0.787 | 0.760 | 0.152 | −0.050 | 15.4 | |
| 1 | 0.857 | 0.748 | 0.731 | 0.653 | 0.602 | 0.576 | 0.550 | 0.491 | 0.026 | −0.041 | 20.5 | ||
| 1 | 0.964 | 0.826 | 0.549 | 0.475 | 0.498 | 0.544 | 0.591 | 0.202 | −0.022 | 27.4 | |||
| 1 | 0.902 | 0.583 | 0.457 | 0.464 | 0.519 | 0.609 | 0.285 | 0.008 | 36.5 | ||||
| 1 | 0.850 | 0.703 | 0.651 | 0.646 | 0.666 | 0.226 | 0.009 | 48.7 | |||||
| 1 | 0.951 | 0.881 | 0.810 | 0.686 | 0.027 | −0.060 | 64.9 | ||||||
| 1 | 0.973 | 0.907 | 0.732 | −0.051 | −0.123 | 86.6 | |||||||
| 1 | 0.974 | 0.786 | −0.044 | −0.192 | 115.5 | ||||||||
| 1 | 0.867 | 0.047 | −0.215 | 154.0 | |||||||||
| 1 | 0.399 | 0.005 | 205.4 | ||||||||||
| 1 | 0.819 | 273.8 | |||||||||||
| 1 | 365.2 |
| Scenario | Exposure Time (min) | UFPs/Total (%) | Total Dose (Particle) | Δ (%) |
|---|---|---|---|---|
| workdays | ||||
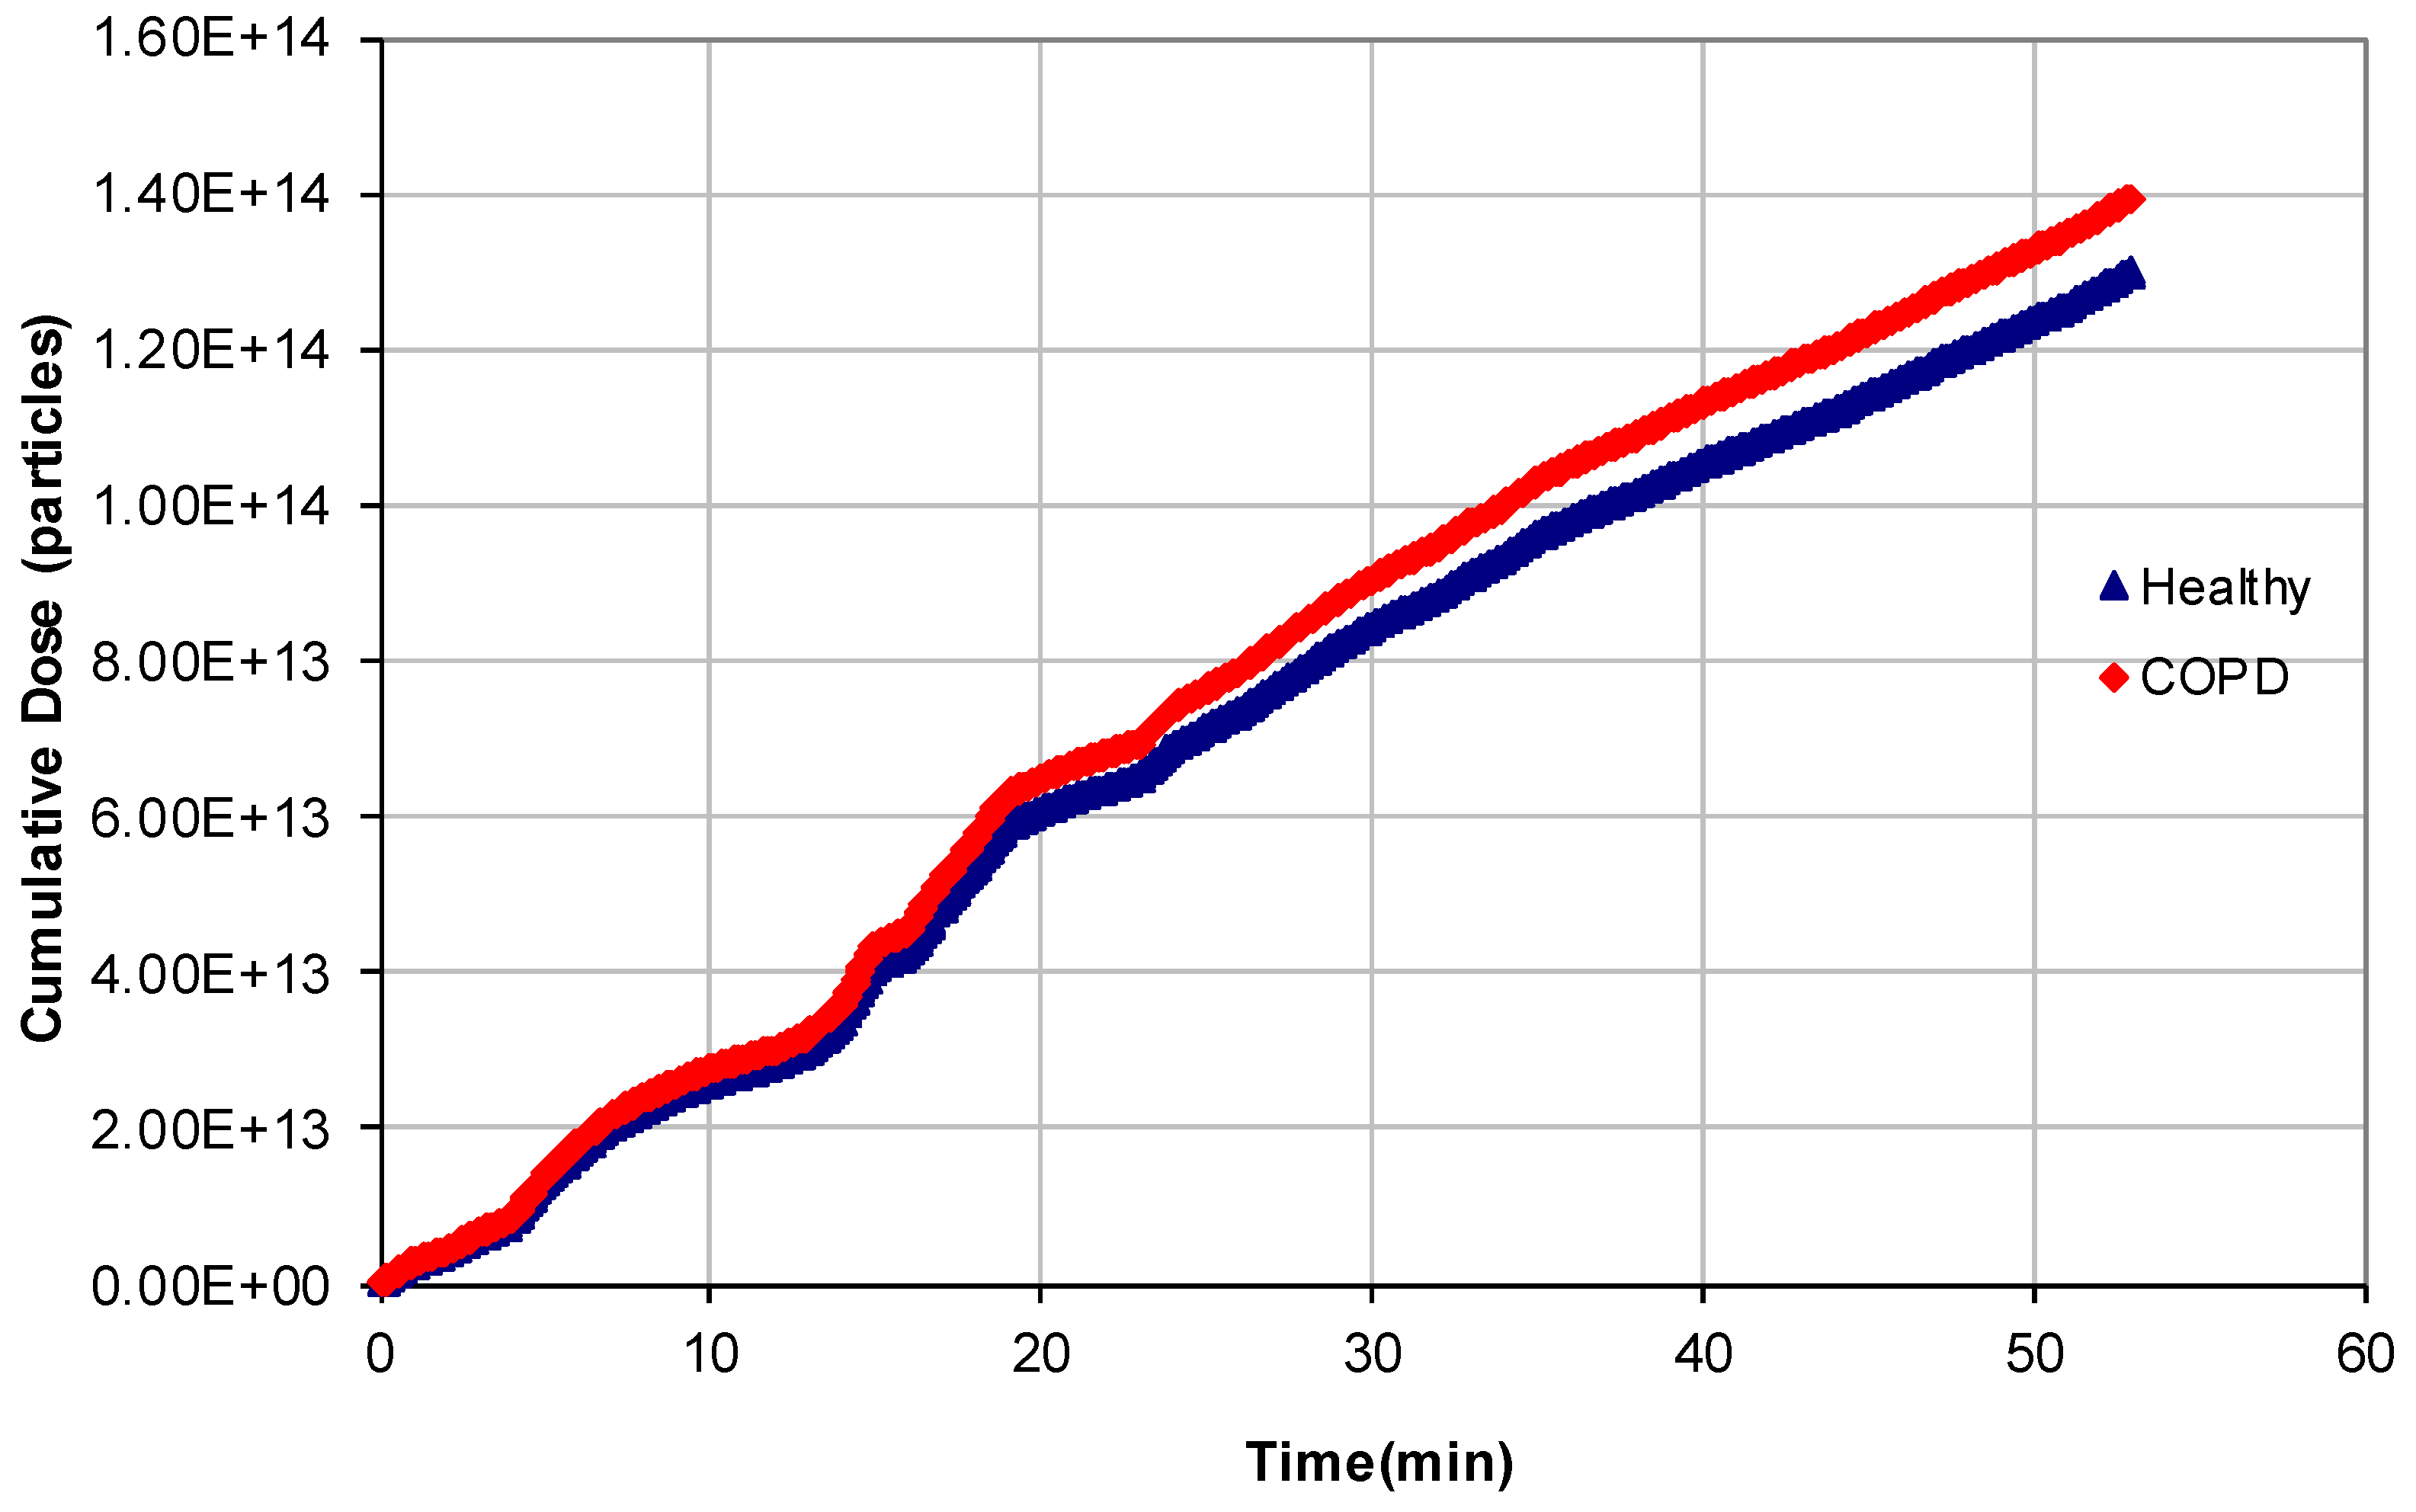
| city path | 52/52 | 87.6/85.8 | 1.30 × 10¹⁴/1.40 × 1014 | +7.3 |
| w traffic light | 9/9 | 92.1/90.8 | 3.56 × 10¹³/3.84 × 1013 | +7.7 |
| w bus stop | 22/22 | 92.1/91.0 | 1.04 × 10¹⁴/1.09 × 1014 | +5.2 |
| holidays | ||||
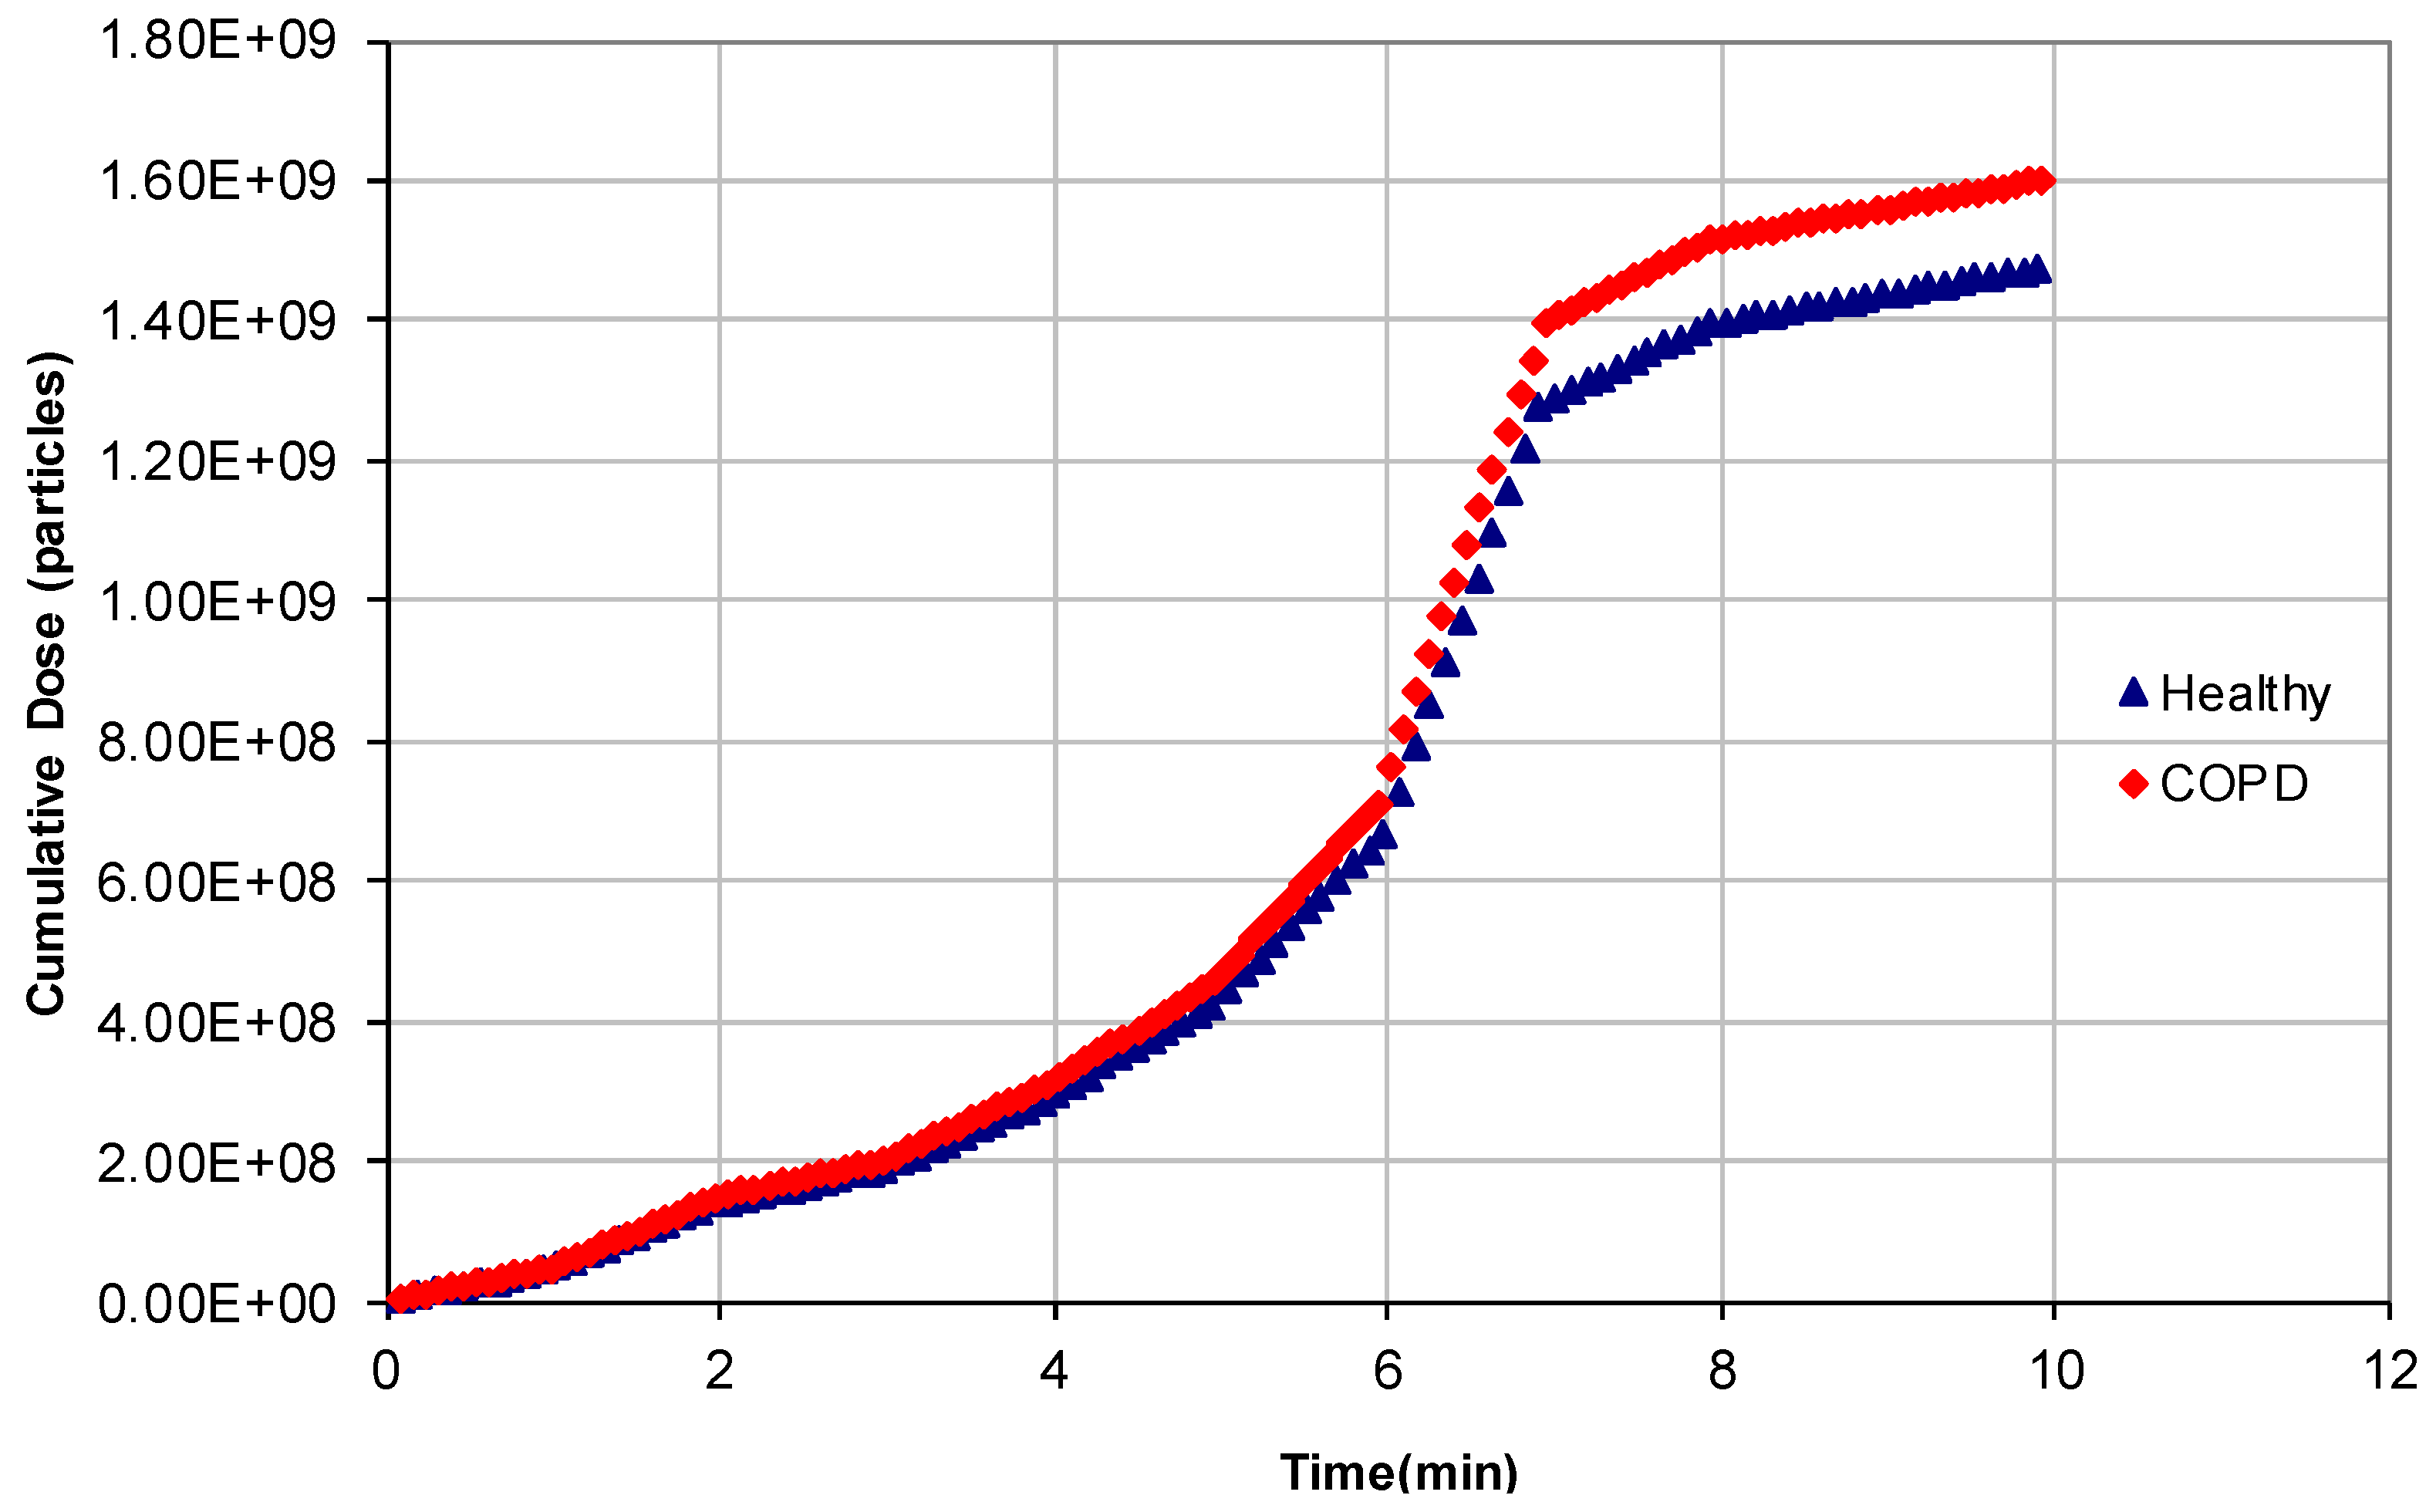
| city path | 34/34 | 90.3/89.0 | 1.72 × 10⁹/1.85 × 109 | +7.7 |
| w traffic light | 9/9 | 94.3/93.6 | 1.47 × 10⁹/1.60 × 109 | +8.5 |
| w bus stop | 22/22 | 88.5/87.0 | 1.14 × 10⁹/1.24 × 109 | +8.4 |
© 2017 by the authors. Licensee MDPI, Basel, Switzerland. This article is an open access article distributed under the terms and conditions of the Creative Commons Attribution (CC BY) license ( http://creativecommons.org/licenses/by/4.0/).
Share and Cite
Manigrasso, M.; Natale, C.; Vitali, M.; Protano, C.; Avino, P. Pedestrians in Traffic Environments: Ultrafine Particle Respiratory Doses. Int. J. Environ. Res. Public Health 2017, 14, 288. https://doi.org/10.3390/ijerph14030288
Manigrasso M, Natale C, Vitali M, Protano C, Avino P. Pedestrians in Traffic Environments: Ultrafine Particle Respiratory Doses. International Journal of Environmental Research and Public Health. 2017; 14(3):288. https://doi.org/10.3390/ijerph14030288
Chicago/Turabian StyleManigrasso, Maurizio, Claudio Natale, Matteo Vitali, Carmela Protano, and Pasquale Avino. 2017. "Pedestrians in Traffic Environments: Ultrafine Particle Respiratory Doses" International Journal of Environmental Research and Public Health 14, no. 3: 288. https://doi.org/10.3390/ijerph14030288