Today, Tokyo is the most populous city in the world; through most of the 20th century it was New York. A century earlier London was the world’s population centre, and Baghdad a millennium before that.
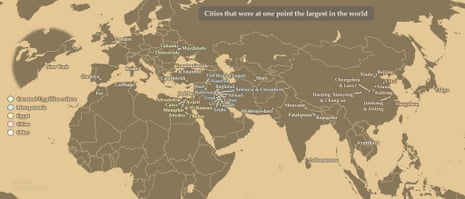
Over the course of human history, a great number of cities have held this title. From Jericho in 7000BC to Tokyo in AD2000, this map plots 48 cities from history, each estimated to have been, at one time, the largest in the world.
It’s difficult enough to determining when a settlement becomes a city, where its true borders lie, and how to measure its population for modern cities, let alone for cities from thousands of years ago. This map is based on historical population estimates from four different researchers, and is not a definitive list. That said, it does offer an overview of the world’s great cultural centres and how they have changed over time.
The world’s earliest population centres exhibit more geographic diversity than you might expect. Of the 10 oldest cities on the map, only three were in Mesopotamia, broadly considered the “cradle of civilisation”. The other seven cities were spread across present-day Ukraine, Egypt, Turkey and the West Bank. And that’s to say nothing of the Indus Valley civilisation in modern-day India/Pakistan, argued by some to be the world’s oldest.
Uber v yellow cab in New York City
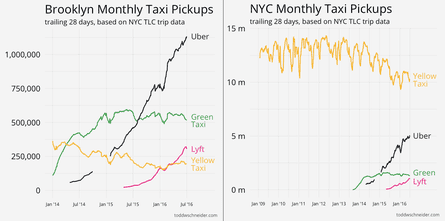
Anecdotes abound regarding the meteoric rise of Uber and its devastation of the traditional taxi industry in cities around the world. However, the comparison is difficult to quantify since available data is limited for both taxis and Uber.
One exception is New York City, where information about for-hire vehicle rides is publicly available and goes back several years. Last year, developer Todd Schneider used this data, comprising over a billion vehicle rides, to produce an extremely detailed analysis described as “an open-source exploration of the city’s neighbourhoods, nightlife, airport traffic, and more, through the lens of publicly available taxi and Uber data.”
Schneider has since updated the analysis to include data for 2016, showing just how far Uber has come in a year.

When will Uber overtake taxis in New York City?
According to Schneider, Uber’s year-on-year growth rate was 90% as of June, 2016. Over the same period, the number of taxis rides fell by 10%. If Uber manages to sustain an average annual growth rate of 40% and taxi ridership continues to decline by 8% a year, Uber will catch up to New York’s taxi industry by 2018.
How bad is the rush hour traffic from Midtown to JFK? Where does the Bridge and Tunnel crowd hang out on Saturday nights? What time do investment bankers get to work? And could Bruce Willis and Samuel L Jackson have made it from 72nd and Broadway to Wall Street in less than 30 minutes?
See Schneider’s full analysis for the answers to these questions and more.
Using Kickstarter data to identify the US’ creative communities
Nashville is famous for its vibrant music scene; Los Angeles is home to America’s film industry – but what about other cities? What creative communities thrive in Seattle, Philadelphia or Cleveland?
Previous studies have investigated this question by analysing employment data. However, as the visual storytelling publication Polygraph points out, those results may not capture the full picture.
Pretty much all existing attempts to map creative communities use census and jobs data. But creative efforts are often side hustles – they’re garage/basement/cottage industries that will not appear in a census.
Polygraph takes a novel approach to this question, teasing out America’s creative communities by analysing the full history of projects successfully crowdfunded via Kickstarter.
Polygraph’s results confirm most of the well-known cultural stereotypes. San Francisco is unsurprisingly heavy in technology projects, and Nashville’s Kickstarter projects predominantly relate to music. But the analysis also points to many other creative communities that are not so well known.
A few highlights:
- Indianapolis and tabletop games – 23% of Indianapolis’ Kickstarter projects are tabletop games, a greater share than any other US city
- Columbus and comics – Columbus’ proportion of comic projects is three times the national average
- Orlando and video games – with a population of only 250,000, Orlando ranks eighth nationally in video game projects.
Follow Guardian Cities on Twitter and Facebook to join the discussion

Comments (…)
Sign in or create your Guardian account to join the discussion