The United States has major transportation infrastructure needs. According to the American Society of Civil Engineers, the surface transportation sector—defined as highway, public transportation, and rail facilities—will face an investment shortfall of approximately $1 trillion over the next decade.
Public-private partnerships (P3s) are often mentioned as a solution to this shortfall.1 This idea is simply wrong. State and local government project sponsors do not lack access to financing but rather have insufficient tax revenues to repay new project debts. As the U.S. Treasury Department notes, “All infrastructure investments ultimately depend on either user fees, government tax revenues, or a combination of both.”2 Government project sponsors can access low-cost financing through the municipal bond market and the Transportation Infrastructure Finance and Innovation Act (TIFIA) loan program at the U.S. Department of Transportation.3 Private financing in the form of private activity bonds (PABs) and equity capital are still project obligations that must be repaid. Simply changing the source of project debts through a P3 does not resolve the two most common restraints on government revenues: economic hardship and insufficient political support.
Public-private partnerships offer state and local governments the ability to shift project risks to a private concessionaire in ways that are not possible through traditional design-bid-build procurement. When structured properly, P3 agreements allow project sponsors to offload three categories of risk: delivery, finance, and operations.4 The private concessionaire charges a premium price for taking on project risks. A key challenge for project sponsors is determining the appropriate risk-adjusted price to ensure that the procurement is cost-beneficial. Given the nation’s major need for expanded and improved surface transportation infrastructure, it is crucial that policymakers understand that risk transference through P3s is not guaranteed.
P3 failures
Proponents of P3s often present risk transference as effectively carried out once the project sponsor and the concessionaire have both signed a contract. This basic description of P3s is accurate but incomplete. Under this conception, the P3 contract is sufficient to ensure that failure will negatively affect the private concessionaire, equity investors, and other creditors—but not the state.
Yet this transactional description of risk transference neglects the fact that the government always remains the ultimate guarantor of project delivery. When a concessionaire fails to fulfill their contractual obligations, the state is forced to take over project delivery—even when this involves substantial delays and cost overruns. The reason the state cannot escape its position of responsibility is essentially political—not in the sense of partisan gamesmanship but because the state is held accountable through public elections.
When a state or local elected official announces a major transportation project, they create a government commitment to the public. The specific details regarding the method of procurement are irrelevant to this political contract between voters and their elected representatives. When the government makes a pledge, the public expects the state to follow through and build what it has committed to build. Elected officials know this. After all, the ballot box holds politicians accountable, not construction subcontractors.
On a practical level, failure to complete a project can have two negative consequences. First, if a promised facility remains unbuilt, residents and businesses must continue to deal with the inadequacies of the existing system that gave rise to the project in the first place. Second, a P3 failure that results in significant losses for bondholders could have harmful long-term effects on future project financing—even if the losses occur on a PAB that does not carry a full faith and credit pledge from the government.
Interest rates on debt principally reflect investor expectations about inflation over time and risk. When the market perceives a particular investment or borrower as risky, interest rates on debt rise. If bondholders lose a significant portion of their investment due to the nonperformance of contract obligations by a concessionaire, this can produce reputational damage for the state or local government project sponsor. In particular, a P3 contract failure signals to future investors that the government may again make a poor choice when selecting a concessionaire. In response, the market would likely demand a higher interest rate on PABs issued for future P3 contracts.
Additionally, allowing bondholders to suffer significant losses sends a strong signal to the market about the politics of a particular state or local government. Debt issued in relation to public infrastructure projects may carry an implicit guarantee that the government will backstop the debt should problems arise. Even though a PAB may not carry a full faith and credit pledge, the market may assume that the state will take steps to protect investors. If the state chooses to allow investor losses, the market learns that no implicit guarantee exists and prices this fact into future debt offerings.
In southern Indiana, the I-69 Section 5 P3 failure demonstrates that using a P3 procurement approach is not a guarantee of success or full risk transference. Section 5 shows that the state remains the ultimate guarantor of project delivery, including covering cost overruns necessary for completion. Finally, the I-69 project demonstrates how the threat of political backlash from failure, combined with the need to preserve future access to affordable credit through the bond market, pushes project sponsors to take extraordinary steps to protect investors from loss.
Project overview and financing
The I-69 Section 5 project involves the reconstruction to full interstate highway standards of 21 miles of State Route 37, an existing four-lane divided highway southwest of Indianapolis, between Bloomington and Martinsville, Indiana.5 The Indiana Finance Authority (IFA) was responsible for the procurement of I-69 Section 5.
The IFA is an instrumentality of the state of Indiana created by the Indiana General Assembly to issue revenue bonds; to serve as a conduit issuer of tax-exempt debt for private borrowers; and to facilitate public-private partnerships, among other purposes. The IFA chose I-69 Development Partners (IDP) as the concessionaire to design, build, finance, operate, and maintain Section 5 for a period of 35 years. In the legal world, IDP was known as a special purpose vehicle—a company created specifically to bid on the Section 5 contract. IDP was owned by two larger firms: Spanish firm Isolux Corsán and Canadian firm Public Sector Pension Investment Board (PSP). In 2017, PSP changed its name to Roadis.
The Section 5 P3 contract relied on an availability payment model. Under the terms of the deal, IDP was responsible for providing a combination of PAB debt and equity capital to finance construction. In addition, the IFA was responsible for making a series of progress payments if IDP hit certain construction targets. Once completed, the IFA would make annual payments—known as availability payments—to IDP over a period of 35 years. In theory, these payments would allow IDP to repay PAB bondholders; cover ongoing operations and maintenance costs; and provide a return for equity investors.
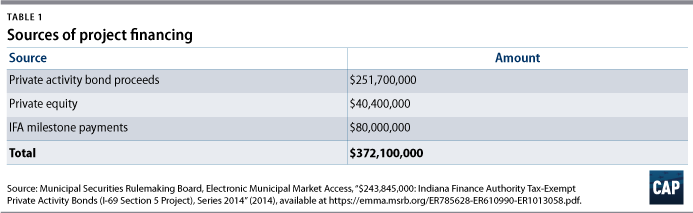
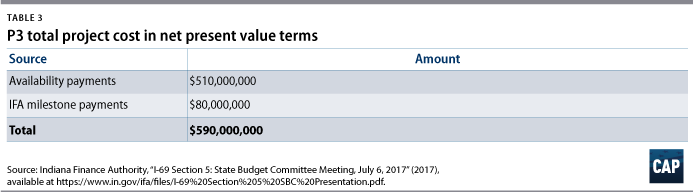
The total construction cost for Section 5 was $369 million.6 The financing for construction included $40.4 million in equity capital, $251.7 million in tax-exempt PAB proceeds, and $80 million in progress payments from the IFA.7 Following construction, the IFA would make availability payments to IDP totaling $1.12 billion or $510 million in net present value terms using a 5 percent discount rate.
Prior to initiating the procurement of Section 5, elected officials and senior administrators at the Indiana Department of Transportation (INDOT) promoted P3s as a way to provide long-term value and savings for taxpayers. Then-INDOT Commissioner Michael B. Cline stated: “We always want to get the best value, and so we’ve been successful to this point in getting a good price on I-69 and getting construction done quickly, and we want to continue on in that.”8 Then-Gov. Mike Pence (R) added that a P3 would provide “a better value for taxpayers.”9 Finally, INDOT officials stated that a central goal of using a P3 would be to “leverage INDOT’s funding appropriations to attract low-cost private sector finance.”10
In the end, the P3 concession failed and the total cost of completing construction on Section 5—excluding operations and maintenance—grew from $369 million to $556.2 million.11 This represents an increase of 51 percent.12 Currently, the project is slated for completion in late summer of 2018—approximately two years behind schedule.
P3 failure and resolution
From the project’s outset, IDP experienced problems.13 Construction on the project started four months late, and IDP quickly fell behind on making payments to subcontractors. Several employees at Isolux Corsán—one of IDP’s parent companies—were arrested on embezzlement charges tied to a different infrastructure project in Spain.14 As the financial condition of IDP deteriorated, the national rating agency Fitch issued a series of ratings downgrades on IDP’s PAB debt.15
In January 2017, the IFA sought to head off the impending insolvency of IDP by agreeing to increase total progress payments by 35 percent—from $80 million to more than $108 million.16 When it became clear that, even with additional public funds, IDP would not be able to complete the project, the IFA decided not to execute this agreement.
Eventually, the IFA began negotiating with all parties to try and reach a comprehensive settlement agreement that would allow the state to take over control of the project and ensure its completion. On July 3, 2017, the IFA signed a settlement agreement that resolved all disputes and claims that “have arisen or may arise with respect to” to the Section 5 project.17 According to the agreement, IDP and the design-build contractor transferred to the IFA “any and all rights, title, and interest…which are necessary or desirable to complete the project.”18
The agreement contains two key provisions that allowed the state to successfully take control and avoid protracted litigation. First, the IFA refunded private activity bondholders their entire principal, or par value, plus accrued interest as well as a modest premium. The money to refund PAB holders came from three sources: $36 million in unspent proceeds from the original PAB issuance; $212 million in proceeds from new revenue bonds issued by the IFA; and $12 million in equity provided by Roadis—formerly known as PSP.19 The refunding of the PABs is notable because it required the Indiana General Assembly to pass special authorizing legislation.20 The legislation states that the IFA may:
Issue bonds and refunding bonds … to provide funding for the completion of the project, to provide funding for any losses or additional costs incurred by the authority under the public-private agreement, or to refund any bonds previously issued by the authority.21
Second, the agreement provided the IFA with a $50 million compensation payment to help partially offset the added cost of completing the project. State and local government project sponsors require contractors to purchase insurance policies that pay out to the government if the concessionaire fails to fulfill its contractual obligations. The insurance companies that underwrite these policies are referred to as the sureties. Under the terms of the settlement agreement, Roadis and the sureties agreed to pay $25.5 million and $24.5 million, respectively. In exchange for making these payments, both Roadis and the sureties were released from any further liability for IDP’s failure to fulfill its obligations for the Section 5 project.
Cost to taxpayers
The complex history of the I-69 Section 5 project makes it difficult to determine the actual cost to Indiana taxpayers. According to a presentation by the IFA to the state’s budget committee, terminating the P3 agreement and completing the project under state control actually saved money in net present value terms, assuming a 5 percent discount rate for all cash flows.22
The primary reason for the lower net total cost to taxpayers stems from three factors. First, IDP agreed to contribute $40.4 million in equity—in combination with PAB proceeds and milestone payments—to finance construction.23 When the IFA took control of the project, IDP had spent approximately $36 million of its original equity commitment.24 Under the terms of the deal, these funds were at risk if IDP failed to fulfill its contractual obligations. As a result, the settlement agreement did not refund any of IDP’s equity expenditure.25 Second, the settlement agreement provided an additional $62 million in private capital and sureties payouts. Of this total, $12 million went to bondholders as part of the redemption and the remaining $50 million went to the IFA to defray added project costs.26 Lastly, the IFA was able to issue revenue bonds to refund PAB holders with a substantial issuance premium and a significantly lower real interest rate.27
The IFA structured its revenue bond to generate a premium purchase price greater than the principal amount of the bonds, known as par. The par value of the IFA revenue bonds was $176.2 million.28 The interest rate—known as the coupon—on the majority of the bond series was 5 percent.29 The 5 percent rate on the IFA bonds is higher than it is on many other investment-grade, tax-exempt debt offerings with an equivalent 20-year maturity. As a result, investors paid a premium purchase price that was $36.1 million, or 17 percent, over par.30 Thus, the IFA issued $176.2 million in bonds and received proceeds totaling $212.5 million before subtracting the underwriting discount and other issuance charges.31
After taking into account the premium over par, the real interest cost of the IFA’s revenue bonds was only 2.9 percent.32 By comparison, the real interest cost on the original PABs was 4.9 percent.33 In effect, the IFA was able to borrow money much more cheaply than IDP. This raises an important question: If the IFA was able to borrow at lower rates than IDP, how much would the project have cost using traditional public financing and procurement from the outset?
To answer this question and to provide an accurate comparison, the hypothetical municipal bond financing must match the coupon rate; the real interest rate—sometimes referred to as the true interest cost— of 2.9 percent; the issuance premium percentage; and the maturity schedule of the revenue bonds issued by the IFA for the PAB refunding. Additionally, the calculation of the net present value of this hypothetical issuance must use the same 5 percent discount rate.
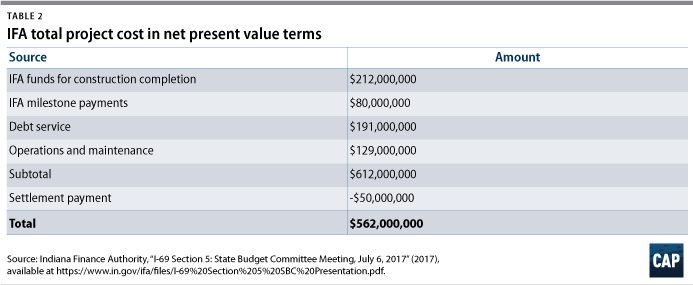
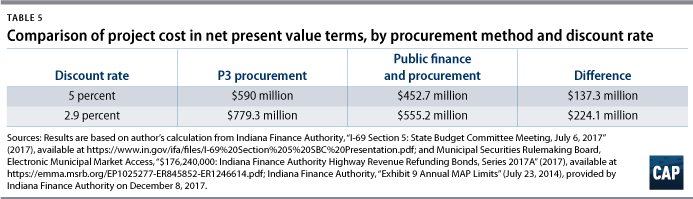
The original construction costs of the project totaled $369 million.34 The IFA agreed to contribute $80 million in public funds to cover a portion of these costs. The remaining $289 million in construction costs must be covered by bond financing. Following the structure and characteristics of the IFA refunding issuance translates to a revenue bond with a par value of $239.8 million and an issuance premium of $49.1 million, or 17 percent. After applying a 5 percent discount rate, the bond has a net present value of $243.7 million.35 This amount is then added to the $80 million in progress payments and the $129 million in net present value of the operations and maintenance costs, coming to a total cost of $452.7 million in net present value for the public financing and procurement option.36

In other words, the public financing option is $137.3 million less in net present value terms than it was under the original Section 5 P3 contract. This is a steep premium to pay a private concessionaire for a straightforward highway reconstruction project in a low-density area. The fact that IDP failed speaks more to their incompetence than it does to the complexity of the project. Typically, delivery risk escalates in dense urban areas that may involve staging challenges as well as significant eminent domain, tunneling, or unexpected utility relocation. The other major risk transferred in a P3 deal is revenue risk. In deals with revenue risk, the concessionaire takes a loss when tolling or other user fees fail to meet expectations.
The Section 5 project was an availability payment contract with no revenue risk in a low-density area. These characteristics, combined with the cost savings of public finance, suggest that Indiana should have used traditional public financing and procurement from the outset.
Discount rates
The final question to consider when comparing the cost of alternative procurement options relates to methodology—specifically, the discount rate a project sponsor should use when comparing different cash flows over time. The IFA used a 5 percent discount rate for evaluating both the P3 and public financing takeover.37 At first, this choice seems sound, as the coupon rate on both the PABs and the IFA bonds is approximately 5 percent. Additionally, 5 percent is on the lower end of the long-run opportunity cost of household investments that were displaced by the taxation required to generate the state revenues needed to repay project financing.38
The opportunity cost of foregone private household investment, however, is not the only or necessarily most common discount rate when assessing infrastructure or other government projects. In fact, governments frequently discount cash flows with a rate equivalent to their real cost of capital. For example, both the White House Office of Management and Budget as well as the Congressional Budget Office use a cost of funds approach for many types of discount analysis.39 For the federal government, the cost of funds is equivalent to the real interest rate on a Treasury security with a long-term maturity. The cost of capital approach may be thought of as a state or local government’s opportunity cost. Since governments don’t make traditional investments for pecuniary gain, the opportunity cost is usually the real rate of interest on a municipal bond or a Treasury security of equivalent maturity—the type of investment instrument purchased by state and local governments as part of a sinking fund or similar account.
The real interest cost of the IFA refunding bonds is 2.9 percent.40 When the P3 and the hypothetical public procurement options are discounted at 2.9 percent, the net present value of the two alternatives changes substantially. The net present value of the public financing option rises by 23 percent, from $452.7 million to $555.2 million, as changing the discount rate affects both the net present value of the bond financing and the operations and maintenance costs over the life of the project.41 For the P3 option, the change in discount rate increases the net present value by 32 percent from $590 million to $779.2 million. In other words, using a discount rate equivalent to the state’s real cost of funds increases the premium associated with choosing a P3 procurement to $224.1 million.42
The reason why lowering the discount rate produces such a substantial change in the net present value of the P3 and public financing options is due to two factors. First, the real cost of capital under the P3 approach is more than twice that under the public option. The real interest rate on the original PABs was 4.9 percent.43 Additionally, the P3 option involved $40.4 million in private equity. Equity investors typically look for annual returns between 10 percent and 15 percent. Taking the low end of this range and combining it with the PAB debt raises the real cost of capital under the P3 deal to roughly 5.9 percent.44 IDP negotiated a contract that included a stream of availability payments that reflected this cost of capital.
Second, the timing of the cash flows for the two procurement alternatives is significantly different. For instance, 65 percent of the IFA’s revenue bond series used to refund PAB holders mature within the first 15 years, and the entire bond series is repaid by 2037—20 years after issuance.45 The hypothetical public option mimics this maturity schedule. By comparison, the original PABs only redeemed 15 percent within the first 15 years, meaning debt repayment was more backloaded. The stream of availability payments reflects this difference. For instance, the IFA was scheduled to make an availability payment to IDP of $49.4 million dollars in 2051.46 In total, the IFA originally agreed to pay IDP nearly $1.2 billion47 over the life of the concession.48 Taken together, the higher cost of capital reflected in the availability payment schedule and the timing of the cash flow lead to a substantially higher net present value for the P3 procurement when using the lower discount rate of 2.9 percent.
This analysis clearly undermines INDOT officials’ claim that a P3 would “leverage INDOT’s funding appropriations to attract low-cost private sector finance.”49 Private financing is more expensive than public financing. The reason to accept the added cost is that a P3 has the potential to provide better long-term value. Yet, it’s hard to envision how a nonrevenue risk concession for a straightforward highway conversion in a mostly rural area could justify the substantial premium—either $137.3 million or $224.1 million, depending on the discount rate—associated with the P3 procurement.
Conclusion
Public-private partnerships are an alternative method of infrastructure procurement. When appropriately structured in concert with a reliable concessionaire, P3s can provide project sponsors with the ability to offload certain risks. The state, however, always remains the ultimate guarantor of project delivery. When the concessionaire fails to meet its contractual obligations, state and local governments are forced to shoulder the political, administrative, and financial burden to ensure a project’s completion. The money to build infrastructure ultimately comes from taxes or user fees, and the responsibility for completing the work rests with the state. In short, P3s are neither a silver bullet nor a guarantee of success.
Kevin DeGood is the director of Infrastructure Policy at the Center for American Progress.