
Mapping the Effects of Parking Minimums
This Friday is our annual #BlackFridayParking event — a nationwide action drawing attention to the harmful nature of minimum parking requirements. Each year on Black Friday, one of the biggest shopping days of the year, people across North America are invited to snap photos of the (hardly full) parking lots in their communities to demonstrate how unnecessary these massive lots are. Participants then upload those photos to social media with the hashtag #blackfridayparking. Get more info about how to participate here.
The following article by our friend Josh McCarty who works at Urban Three (a consulting firm specializing in land value economics, property and retail tax analysis) uses concrete data to illustrate exactly why parking minimums are so harmful to the economic success of our towns.
What makes surface parking so destructive is that it consumes a finite resource (land) with virtually no direct financial benefit. Our pre-occupation at Urban Three is local finance. From that perspective, parking — in particular the vast kind that adorns strip malls and box stores — is dead weight. Local governments, be they in cities, towns, or counties, are all constrained by the land they can develop. What they do with that resource is thus, paramount to how well they can pay their bills. Tax revenue is but one of many resources squandered by each acre of land devoted to deactivated cars.
This year for #BlackFridayParking, I’ll delve deeper into the pattern of tax productivity in Urban Three's 3D models to focus on the impact of surface parking. Those of you who are familiar with Urban Three will recognize the image below as the incredibly common pattern of property tax production per acre:
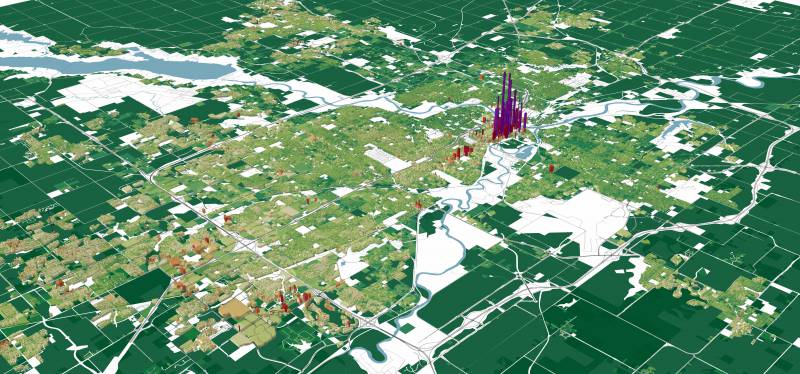
The low-lying green and yellow developments are those that produce a low amount of tax revenue, while the tall purple and red plots have a high tax value.
What’s fascinating about this model is that, without knowing the city or county, having no idea what the underlying development looks like, it’s nearly impossible not to find downtown. (The image is Des Moines, Iowa by the way.) Smaller satellite downtowns, new urban developments, and historic districts are similarly easy to find. What’s more difficult to find are the typical symbols of economic development. Can you find any of the three major shopping malls in this model? The vast office park headquarters of Wells Fargo? The Bass Pro Shop?
They blend in with the background radiation of suburban housing and are eclipsed by the potency of compact development. It’s important to keep in mind that this means an acre of big box store or shopping mall is only marginally more productive than one modestly sized detached housing.
Of course, developments like big box stores are not touted as success without cause. They often hold a substantial share of a community’s economic activity and produce more property tax individually than downtown buildings. What accounts for this huge disparity in tax productivity though, is configuration. Parking dilutes the substantial tax production of development with fiscally barren waste. When we account for that waste, we see a much different pattern of tax production.
MAPPING LAND WASTE
We can infer a great deal about the urban fabric from models like the one shown above, and we can supplement that understanding with some direct concrete examples. For today's data project, though, we also supplemented with land cover data, which gave us the opportunity to more directly compare compact land use with tax productivity. This data codifies the components of development, building footprints, roads, and of particular importance, parking.
For hundreds of years, figure ground maps such as this have been instrumental for understanding how development is woven together to form a place, or, what some call, the urban fabric. With these other elements at our disposal we can explore a more perverse kind of map: the distribution of parking in the city. In the map below, parking is illustrated in glaring red.
Let’s take a closer look at how different configurations of buildings and parking contribute to tax production efficiency in this example city of Des Moines.

The downtown area has the most compact, "urban" pattern of development and corresponds to the most potent taxable properties. Note the proportion of black (buildings) to red (parking) along the four block wide swath between the rivers. This is also where the road network is the most predictable and uninterrupted. Within these blocks, almost all available space is used for buildings. In short, this is the fingerprint of an urban area.
Here's an aerial photo of the city for some perspective:
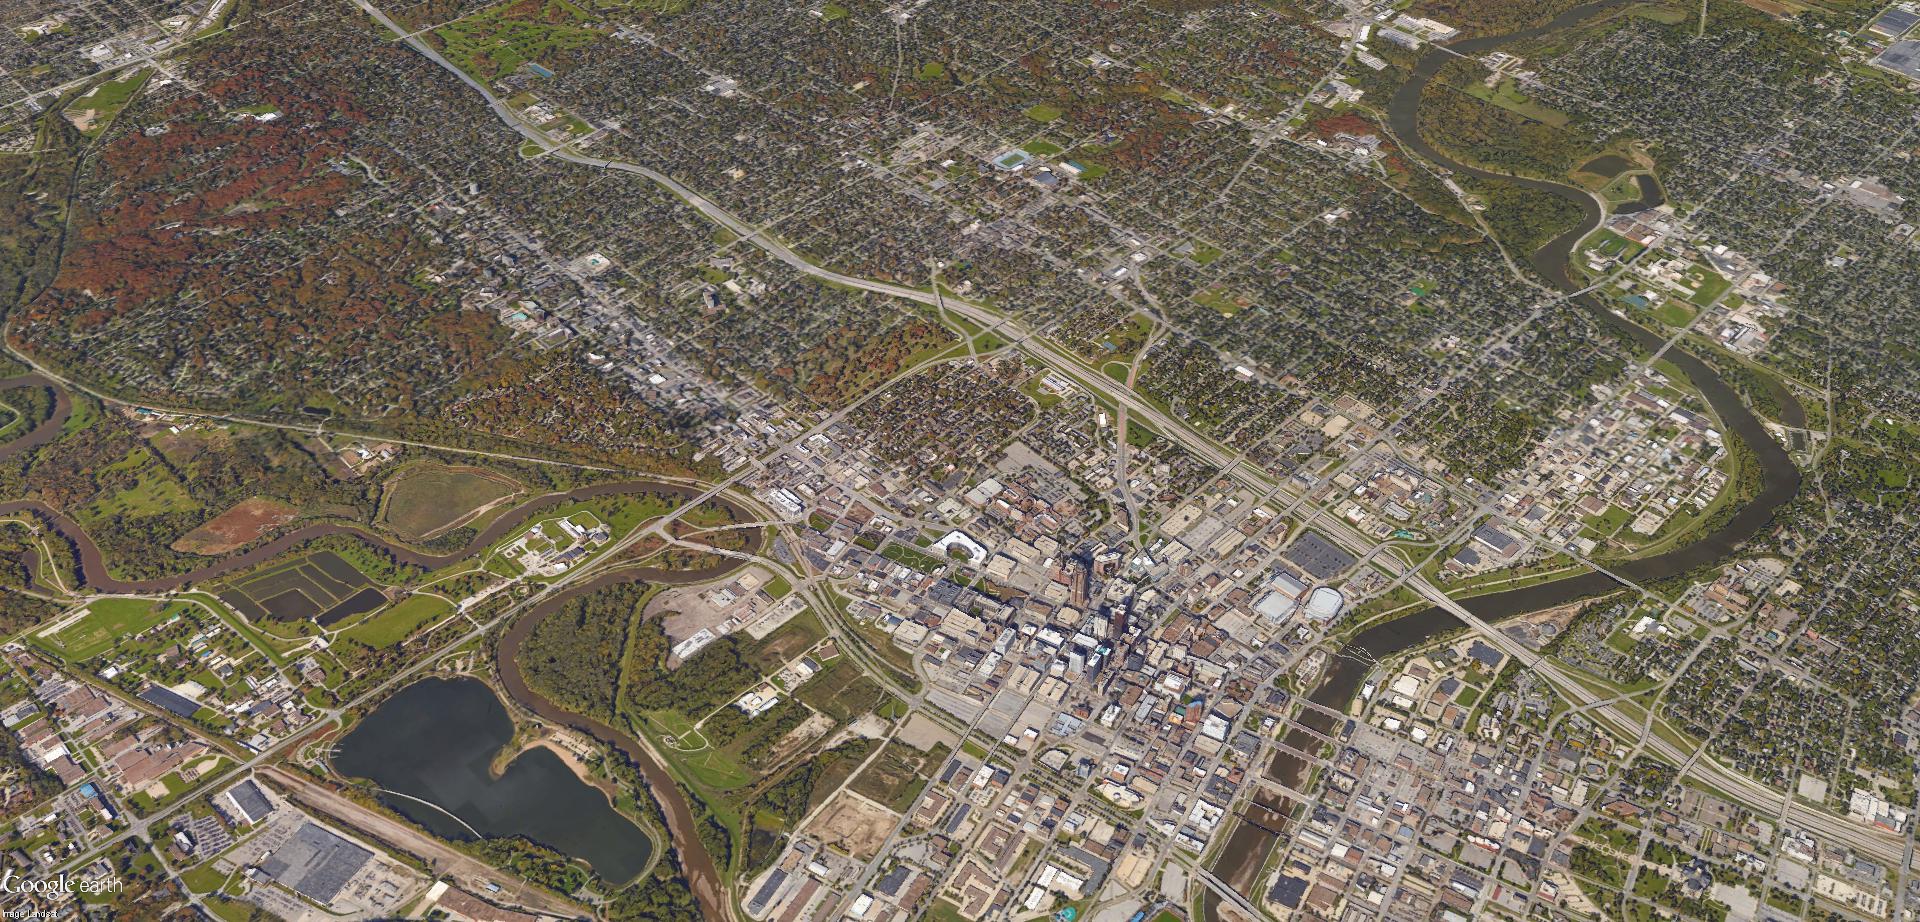
What the 2D illustration above fails to capture, though, is the compounded effect of not just covering land with buildings but stacking those buildings. Here's what that looks like:
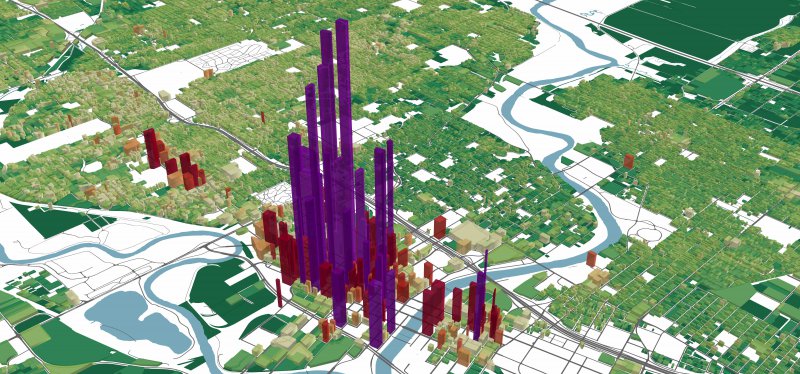
The vast majority of development is just a few stories, if that. Compact development uses all of its space and then some.
We find this same pattern of tax productivity at a smaller scale even in humble Main Street settings:
Small Town Main Street


Notice how the configuration of the few blocks featured here has a profound impact on tax productivity. These are historic properties built before cars and car storage. The scarcity of developable land encouraged developers to maximize use of their sites. Once again, using at least 100% of a lot for a building is the key to boosting tax production.
Now let’s contrast the previous patterns and height with a decidedly auto-oriented development:
Auto-Oriented Suburb


This is a major commercial corridor nestled along a major interchange. It boasts a shopping mall, numerous retail sites, and a substantial office park. Both the main street and the suburban configurations have considerable amounts of development and even have comparable amounts of pavement. The main street model locks small irregular developments along the street and tucks its parking off to the back in smaller pockets. The primary focus is more recognizably human.
Meanwhile, the auto-oriented model maximizes distance between the street and the building and assembles its parking into large pools. The 3D model clearly shows financial benefits to accommodating humans on foot versus storing cars.
One striking and troubling observation is the extent to which even the downtown is burdened with parking. The entire periphery of the potent urban core is lined with bare pavement. Downtown sits like a shining revenue oasis in a sea of flat pavement. Our small town main street example too comes with its own red ring.
All the more troubling is that much of this parking was built on the remains of irreplaceable historic architecture. The proximity of these red swaths to major highway projects is also no accident. The “meat axe” of urban highway construction, as Robert Moses famously named it, tends to leave a scar in the form of broken real estate. And even within the intact urban core, parking has a conspicuous presence in the form of multi-level garages. There's no escaping this ubiquitous pavement.
THE TAX CONTRIBUTION OF BARE PAVEMENT
One advantage of 3D modelling is that it gives us the ability to explore multiple layers of data at once. We typically depict both the height of the property and its color based on its tax value per acre. But we can delve deeper into the question of parking by coloring property based on its relative content.
In this model, height still represents value per acre, but redder properties have a greater proportion of parking, while bluer ones have more building. For our purposes we’ll ignore other uses like open space and we’ll consider driveways as though they were parking.
The result, aside from looking patriotic, is fairly noisy but nonetheless depicts a clear advantage for “very blue” over “very red” properties.

Ultimately parking is the single most important design feature that dilutes the tax productivity of development. Municipalities for whom property taxes are lifeblood should treat parking for what it is: dead weight.
Sadly the typical outlook found in zoning codes in most cities is to encourage such waste.
(All images copyright of Urban Three. A different version of this article was originally published in 2015).
Related Stories:

Joshua McCarty is Urban3’s Chief Analytics Researcher and resident Geo-Accountant. Geo-Accounting, a portmanteau of geography and accounting, is inspired by the foundational geodesign work of those such as Ian McHarg. Just as geodesign seeks to improve design through spatial awareness, Josh’s work focuses on new ways to visualize local finance. At the core of this work is an ongoing effort to quantify, measure, and communicate patterns of urban development and the outcomes of design choices. Prior to joining Urban3, Josh worked as a researcher quantifying sprawl and environmental impacts in the Chesapeake Watershed and nationally. His graduate education at the University of North Carolina’s Department of City and Regional Planning focused on real estate development. Josh has extensive experience with GIS, local government finance, and economics.