
For seven decades urban planners have been seeking to force higher urban population densities through urban containment policies. The object is to combat "urban sprawl," which is the theological (or ideological) term applied to the organic phenomenon of urban expansion. This has come at considerable cost, as house prices have materially increased relative to incomes, which is to be expected from urban containment strategies that ration land (and thus raise its price, all things being equal).
Smart Growth America is out with its second report that rates urban sprawl, with the highest scores indicating the least sprawl and the lowest scores indicating the most (Measuring Sprawl 2014).
Metropolitan Areas and Metropolitan Divisions
For the second time in a decade Smart Growth America has assigned a "sprawl" rating to what it calls metropolitan areas. I say "what it calls," because, as a decade ago, the new report classifies "metropolitan divisions" as metropolitan areas (Note 1). Metropolitan divisions are parts of metropolitan areas. This is not to suggest that a metropolitan division cannot have a sprawl index, but metropolitan divisions have no place in a ranking of metropolitan areas. Worse, metropolitan areas with metropolitan divisions were not rated (New York, Los Angeles, Chicago, Dallas-Fort Worth, Philadelphia, Washington, Miami, San Francisco, Detroit, and Seattle).
This year's highest rating among 50 major metropolitan areas (over 1,000,000 population) goes to part of the New York metropolitan area (the New York-White Plains-Wayne metropolitan division) at 203.36. The lowest rating (most sprawling) is in Atlanta, at 40.99. This contrasts with 2000, when the highest rating was in part of the New York metropolitan area (the New York PMSA), at 177.8, compared to the lowest, in the Riverside-San Bernardino PMSA portion of the since redefined Los Angeles metropolitan area, at 14.2. Boston is excluded due to insufficient data (Note 2)
Rating Sprawl
The sprawl ratings are interesting, though obviously I would have done them differently.
Overall urban population density would seem to be a more reliable indicator (called urbanized areas in the United States, built-up urban areas in the United Kingdom, population centres in Canada, and urban areas just about everywhere else). For example, the Los Angeles metropolitan area (combining its two component metropolitan divisions), has an index indicating greater sprawl than Springfield, Illinois. Yet, the Los Angeles urban area population density is about four times that of Springfield (6,999 residents per square mile, compared to 1747 per square mile, approximately the same as bottom ranking Atlanta). The implication is that if Los Angeles were to replicate the individual ratings that make up its index, and covered (sprawled) over four times as much territory, it would be less sprawling than today.
This case simply illustrates the fact that sprawl has never been well defined. Indeed, the world's most dense major urban area, Dhaka (Bangladesh), with more than 15 times the urban density of Los Angeles and 65 times the urban density of Springfield, has been referred to in the planning literature as sprawling.
Housing Affordability
The principal problem with the report lies with its assertions regarding housing affordability. Measuring Sprawl 2014 notes that less sprawling areas have higher housing costs than more sprawling areas (Note 3). However, it concludes that the lower costs of transportation offset much more all of the difference. This conclusion arises from reliance the US Department of Housing and Urban Development (HUD) and US Department of Transportation (DOT) Location Affordability Index, which bases housing affordability for home owners on median current expenditures, not the current cost of buying the median priced home. Nearly two thirds of the nation's households are home owners, and most aspire to be.
HUD-DOT describes its purpose as follows:
"The goal of the Location Affordability Portal is to provide the public with reliable, user-friendly data and resources on combined housing and transportation costs to help consumers, policymakers, and developers make more informed decisions about where to live, work, and invest."
Yet, a consumer relying on the Location Affordability Index could be seriously misled. The HUD-DOT index (Note 4) does not begin to tell the story to people seeking to purchase homes. The costs are simply out of pocket housing costs, regardless of whether the mortgage has been paid off and regardless of when the house was bought (urban containment markets have seen especially strong house price increases).An index including people who have no mortgage and people who have lower mortgage payments as a result of having purchased years ago cannot give reliable information to consumers in the market today.
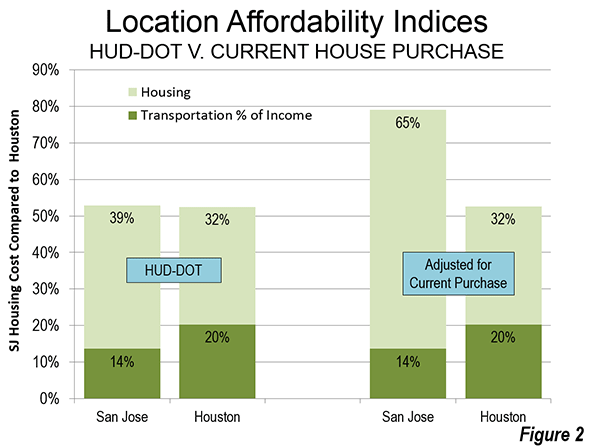
A household relying on this source of information would be greatly misled. For example, comparing Houston with San Jose, according to HUD-DOT, owned housing and transportation consume virtually the same share of the median household income in each of the two metropolitan areas. In Houston, 52.5 percent of income is required for housing and transportation, while the number is marginally higher than San Jose (52.9 percent).
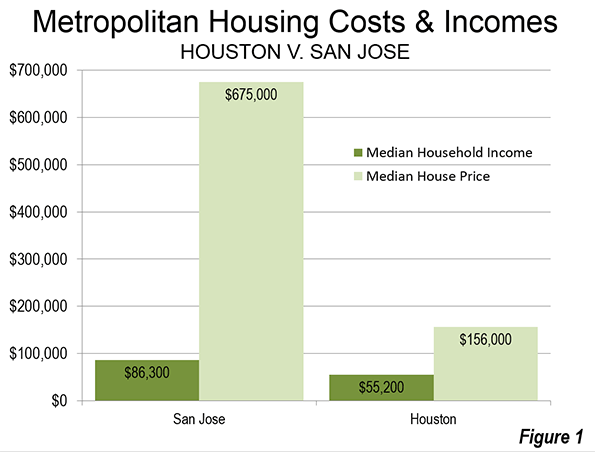
But the HUD-DOT numbers reflect nothing like the actual costs of housing in San Jose relative to Houston. The median price house in Houston was approximately $155,000, 2.8 times the median household income of $55,200 (this measure is called the median multiple) during the 2006-10 period used in calculating the HUD-DOT index. In San Jose, the median house price was approximately $675,000, 7.8 times the median household income of $86,300 (Figure 1).
If the Location Affordability Index reflected the real cost for a prospective home owner (HUD-DOT costs including a market rate mortgage for the house), a considerable difference would emerge between San Jose and Houston. The combined San Jose Location Affordability Index for home owners would rise to 85 percent of median household income, a full 60 percent above the Houston figure, rather than the minimal difference of less than one percent indicated by HUD-DOE (Figure 2).
Under-Estimating the Cost of Urban Containment
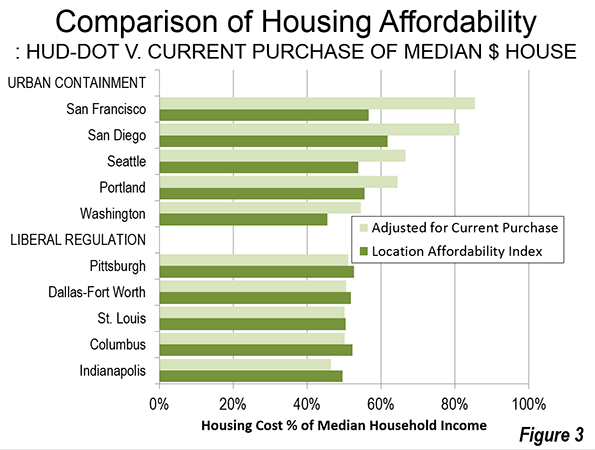
There is a substantial difference between the HUD–DOT housing and transportation cost and the actual that would be paid by prospective buyers. Five selected urban containment markets indicate a substantially higher actual housing cost than reflected in the HUD–DOT figures. On the other hand, in the selected liberally regulated markets (or traditionally regulated markets), the HUD–DOE figure is much closer to the current cost of home ownership (Figure 3). This is a reflection of the greater stability (less volatility) of house prices in liberally regulated markets. Overall, based on data in the 50 major metropolitan areas, owned housing costs relative to incomes rise approximately 6 percent for each 10 percent increase in the sprawl index – that is, less sprawl is associated with higher house prices relative to incomes (Note 6).
The increasing impacts of urban containment’s housing cost increases have been limited principally to households who have made recent purchases. The effect will become even more substantial in the years to come as the turnover of the more expensive housing stock continues.
Granted, the 2006 to 2010 housing data includes part of the housing bubble and its higher house prices. However, house prices relative to incomes have returned to levels at or above that recorded during the period covered by Measuring Sprawl 2014 in "urban containment" markets, such as San Francisco, San Jose, Los Angeles, San Diego, Seattle, Portland, and Washington.
Economic Mobility and Human Behavior
Another assertion requires attention: economic mobility is greater in less sprawling metropolitan areas. The basis is research by Raj Chetty and Nathaniel Hendren of Harvard University and Patrick Kline and Emmanuel Saez of the University of California, Berkeley. However, the realities of domestic migration suggest caution with respect to the upward mobility conclusions, as is indicated in Distortions and Reality About Income Mobilityand in commentary by Columbia University urban planner David King.
Virtually all urban history shows city growth to have occurred as people have moved to areas offering greater opportunity. Jobs, not fountains, theatres and art districts, drive nearly all the growth of cities. This means that there should be a strong relationship between the cities net domestic migration and the economic mobility conclusions of the research. The strongest examples show the opposite relationship.
Domestic migration is strongly away from some metropolitan areas identified in the research as having the greatest upward income mobility also had substantial net domestic migration losses. For example, despite claims of high economic mobility New York, Los Angeles and the San Francisco Bay area, each lost approximately 10 percent of their population to net domestic migration in the 2000s. On the other hand, some metropolitan areas scoring the lowest in upward economic mobility drew substantial net domestic migration gains. For example, low economic mobility Charlotte and Atlanta gained 17 percent and 10 percent due to net domestic migration in the 2000s. Thus, the results of the economic research appear to be inconsistent with expected human behavior (Note 7).
Sprawl: An Inappropriate Priority
The new sprawl report is just another indication that urban planning policy has been elevated to a more prominent place than appropriate among domestic policy priorities. The usual justification for urban containment is a claimed sustainability imperative for its densification and anti-mobility policies. Yet, these policies are hugely expensive and thus ineffective at reducing greenhouse gas emissions, and thus have the potential to unduly retard economic growth (read "the standard of living and job creation"). Far more cost-effective alternatives are available, which principally rely on technology.
There is a need to reverse this distortion of priorities. Little, if anything is more fundamental than improving the standard of living and reducing poverty (see Toward More Prosperous Cities). Housing is the largest element of household budgets and policies of that raise its relative costs necessarily reduce discretionary incomes (income left over after paying taxes and paying for basic necessities). There is no legitimate place in the public policy panoply for strategies that reduce discretionary incomes.
London School of Economics Professor Paul Cheshire may have said it best, when he noted that urban containment policy is irreconcilable with housing affordability.
---------
Note 1: The previous Smart Growth America report used primarily metropolitan statistical areas (PMSAs), which have been replaced by metropolitan divisions. The primary metropolitan statistical areas were also subsets of metropolitan areas (labor market areas). This is problem is best illustrated by the fact that the Jersey City PMSA, composed only of Hudson County, NJ, is approximately one mile across the Hudson River from Manhattan in New York. Manhattan is the world's second largest central business district and frequent transit service connects the two. Obviously, Jersey City is a part of the New York metropolitan area (labor market area), not a separate labor market.
Note 2: Because of incomplete data, Boston is not given a sprawl rating in Measuring Sprawl 2014. A different rating system in the previous edition resulted in a Boston rating among the least sprawling. Yet, the Boston metropolitan area is characterized by low density development. Outside a 10 mile radius from downtown, the population density within the urban area is slightly lower than that of Atlanta (same square miles of land area used).
Note 3: Higher house prices relative to household incomes are more associated with policies to control urban sprawl (such as urban growth boundaries and other land rationing devices), than with the extent of sprawl. More compact (less sprawling) urban areas do not necessarily have materially higher house prices. For example, in 1970, the Los Angeles urban area was one of the most dense in the United States, yet it was within the historical affordability range (a median multiple of less than 3.0). The emergence of Los Angeles as the nation's most dense urban area in the succeeding decades (and 30 percent increase in density) is largely the result of a change in urban area criteria. Through 1990, the building blocks of urban areas were municipalities, which meant that many square miles of San Gabriel Mountains wilderness were included, because it was in the city of Los Angeles. Starting in 2000, the building blocks or urban areas became census blocks, which are far smaller and thus exclude the large swaths of rural territory that were included before in some urban areas.
Note 4: The transport costs from the Location Affordability Index are accepted for the purposes of this article.
Note 5: The current purchase housing cost is based on the average price to income multiple over the period of 2006 to 2010, relative to the median household income (calculated from quarterly data from the Joint Center for Housing Studies of Harvard University, State of the Nation's Housing 2011). It is assumed that the buyer would finance 90 percent of the house cost at the average 30 year fixed mortgage rate with points over the period. The 10 percent down payment is allocated annually in equal amounts over the 360 months (30 years). The final annual cost estimate is calculated by adding the monthly mortgage payment and down payment allocation to the median monthly housing cost in each metropolitan area for households without a mortgage.
HUD-DOT uses the "selected monthly owner cost" from the American Community Survey (ACS) for its cost of home ownership. According to ACS, “Selected monthly owner costs are calculated from the sum of payment for mortgages, real estate taxes, various insurances, utilities, fuels, mobile home costs, and condominium fees."
Note 6: This is based on a two-variable regression estimation (log-log) with the sprawl index as the independent variable and the substituted housing share of income as the dependent variable for the 50 largest metropolitan areas (excluding Boston), It is posited that most of the variation in housing costs is accounted for by variation in land costs. Other significant factors, such as construction costs and financing costs in this sample vary considerably less. A sprawl index for each metropolitan areas represented by metropolitan divisions (not provided in the sprawl report) is estimated by population weighting.
Note 7: Another difficulty with that research is that it measured geographic economic mobility at age 30, well before people reach their peak earning level. This is likely to produce less than reliable results, since those who achieve the highest incomes as well as the most educated such as medical doctors and people with advanced degrees) are likely to have larger income increases after age 30 than other workers.
Wendell Cox is principal of Demographia, an international public policy and demographics firm. He is co-author of the "Demographia International Housing Affordability Survey" and author of "Demographia World Urban Areas" and "War on the Dream: How Anti-Sprawl Policy Threatens the Quality of Life." He was appointed to three terms on the Los Angeles County Transportation Commission, where he served with the leading city and county leadership as the only non-elected member. He was appointed to the Amtrak Reform Council to fill the unexpired term of Governor Christine Todd Whitman and has served as a visiting professor at the Conservatoire National des Arts et Metiers, a national university in Paris.
Suburban neighborhood photo by Bigstock.


Measuring Sprawl Impacts on Housing Affordability
Although I agree that affordability (defined as lower-income households' ability to purchase basic goods and services, including adequate housing) is an important issue, and that affordability analysis should consider housing purchase costs as well as expenditures, this analysis is incomplete and biased, and I believe that the conclusions are backward.
This analysis makes the classic analytical error of assuming that correlation proves causation. Smart growth tends to be implemented in regions that have a combination of rapid growth, geographic constraints (such as shorelines and mountains), and high environmental amenities, which tend to increase housing prices, particularly single-family homes, due to strong demand and limited land supply. As a result, it is unsurprising that growing coastal cities such as San Francisco, San Diego, Seattle, Portland and Washington DC have higher housing prices than cities with fewer geographic constraints such as Pittsburgh, Dallas, St. Louis, Columbus and Indianapolis, but it is wrong to assume that this is caused by smart growth policies. To accurately explore this issue the analysis needs to use more sophisticated analysis which accounts for population and economic growth rates and natural geographic constraints.
The analysis also inaccurately assumes that smart growth consists of just one policy, urban containment regulations. Smart growth includes a variety of policies and planning practices that result in more compact, mixed, multi-modal development patterns, including reduced restrictions on development density and mix, reduced parking requirements, and improvements to walking, cycling and public transport. Although some smart growth policies may increase housing costs, others provide savings.
In a free market, growing and geographically constrained cities such as San Francisco and Boston tend to have relatively high housing costs, just as quality restaurants tend to have higher prices than fast food restaurants; or described differently, property owners in less attractive cities such as Pittsburgh and Columbus must offer relatively cheap housing to attract residents. However, growing and geographically constrained cities can increase affordability and accommodate more residents and jobs with appropriate smart growth policies. For example, allowing increased densities and more multi-family housing, reducing parking and setback requirements, and reducing development and utility fees in more compact locations (in recognition of the lower costs of providing public services there), can help make housing and transportation more affordable in cities like San Francisco and Boston.
The conclusion that smart growth reduces housing affordability is backward: the best way to provide true affordability and satisfy consumer preferences in growing, geographically constrained communities is to implement more of the smart growth policies that support affordable-accessible housing (lower-priced housing in accessible, multi-modal neighborhoods).
For more detailed analysis of these issues see my Planetizen column, "How Not to Evaluate Housing Affordability" (http://www.planetizen.com/node/68305 ).
Todd Litman is founder and executive director of the Victoria Transport Policy Institute (www.vtpi.org), an independent research organization dedicated to developing innovative solutions to transport problems.
Cox is right to focus on fringe containment
That is one incredibly biased comment, in the course of which someone else is accused of bias on the most flimsy and insupportable grounds.
There are plenty of cities surrounded by flat land in which urban containment policies have been enacted, and housing has ended up unaffordable. Most of the UK falls into this category. Also many Australian, Canadian and New Zealand cities.
There is also abundant evidence of a historic era of housing affordability that included geographically difficult cities, even when they were fast growing. California's cities themselves grew far faster than what they are now (faster even than Texas cities are now), during the 1950's and 60's, without affordability being a barrier to prospective new residents.
The focus on fringe growth containment as the culprit for affordability, is entirely appropriate and based on real world observation. There is no example in the world of a city with fringe containment that has restored housing affordability by upzoning and intensification and reducing living space per person. In fact all that happens from cramming more people in per site, is that site rents are increased. Hence the UK's urban land prices being hundreds of times unconstrained US cities; and tens of times growth constrained US cities with low density mandates. Density when fringe growth containment is present, merely determines whether housing will be spacious and unaffordable, or overcrowded and unaffordable. The gouge of extractive economic rent "per person" remains about the same.
Therefore, fringe growth containment and upzoning are both part of the worst wealth transfer gouge by the powerful 1%, that has occurred in modern economic history.
The only ways to restore affordability where it has been ended by smart growth, is to allow for competitive "vent" growth on still-cheap exurban land; OR to start compulsorily acquiring property for "smart growth" type development, kind of how they do in Singapore. Even then, Singapore is only "cheap" compared to Hong Kong.
All the other aspects of smart growth will work better if there is "vent" growth occurring on rural land that is acquirable by a genuinely competitive process, keeping the cost of urban land systemically lower. Smart growth development nodes in Atlanta and Houston are actually affordable, not exclusionary yuppie enclaves as they turn out to be everywhere there is fringe growth containment and systemic unaffordability.
Defining Sprawl
It is great that Cox wants to further understand sprawl and low density urban development, the integrity of his theories and ideals depend on it. I would buy into his proposals if he explained some things about his take on sprawl have an integral connection to their urban cores, in terms of necessary parallel development or to further centralize functions in the core? Do these suburbs further develop in the future or do they developmentally stagnate and this growth shifts down to other cheap land and job nexuses? Is diversity in housing inventory (apartments, townhouses rooms, condos) not as important as an over simplistic "median house/median income gauge? Aren't there different socio-economic classes to whom this gauge will fail? Are there any other prosperity increasing agents that suburbs provide other than more discretionary spending?
Focus on People, not Sprawl
In what sense can the historic patterns of development be condsidered pro people? What does "pro People" mean in Cox-speak beyond "affordability" as a yardstick. Classically, dense habitat, especially that considered most livable by affluent ex-urbanites, has been represented by organically constrained "villages" and small towns. If we build phony "villages" as outlying commuter enclaves, have we truly constructed "communities" just because the developers' brochures say so? I think not. The issue is far more complex than a discussion of either affordability or one of economic and cultural proximity to true cities can reveal. The common denominator of a democratic market should not be banality and license for the unfettered exercise of "taste". Either urban planning can be evaluated rationally or it cannot. Simple premise. The rational is not necessarily synonymous with the popular, however. Is there no geographical limit to sprawl in Cox's world, or is the market the only fair determinant of how much environmental degradation and suburban isolation is permissible?
I think you are right the
I think you are right the closest thing to anyone voting and expressing a true opinion would be these affluent ex-urbanites not the financially and economic coerced voting of the middle class. Cox should say something of the poor pushed to exurbs and the regional urban areas that are running out of prospective suburban land that are close to urban cores and evaluate limits of spatial expansion. If he devout to affordability he should also think of the value of my money and not only its size, what I can invest and spend within 32min of my home whether within a more economically vibrant and competitive urban area or an isolated suburb.
Choice? Choice? Are you sincere?
In what cities do the poor have the most choices: a city where developable exurban land is $10,000 per acre, under-development fringe land is $50,000 an acre, and the most expensive land prices near the centre are $300,000 an acre:
OR a city with a ban on developing exurban land; fringe land costing $1,000,000 per acre (with land bankers and incumbent rural owners creaming capital gains); and the most expensive land near the centre costing $20,000,000 per acre?
It is sickening that people who claim to care about the poor and about their options for housing and lifestyle choices, support policies that cause centrally located townhouses to be $1,000,000 instead of $100,000.
This is why the poor so often choose to move to Texas.
http://content.time.com/time/magazine/article/0,9171,2154995,00.html
Contrary to the smart growth fascist-propagandists, the poor actually know they have a LOT MORE CHOICE in Texas.
the common denominator of a democratic market
Sorry but the common denominator of markets is money. People vote their dollars every day and the voters have spoken: it's traditional free market growth in a landslide over you coercive, authoritarian chaps. You really don't know what's good for other people and you really shouldn't be allowed to meddle in their lives.
Especially when......
ESPECIALLY when the "we know what's good for you" utopians and the big-money vested interests are on the same side. What is the level of capital gains to property rentiers when these utopian planners start restricting sprawl and doing upzonings? It is all based on lies anyway.